All pairs in 1 indicator window
Another method is using the indicator W_RVIM as a normal RVI indicator for each pair.
-Open eurusd chart TF M15
-place the W_RVIM(10) indicator in the indicator window
-drag and drop the other W_RVIM indicators in the same indicator window
-adjust the W_RVIM indicators:
(Fixed Min, Fixed Max/NumberPairs /Pairs1,2,3,4,5,6 /colors/ Levels (0)
-Place the indicator W_RVIM(10) in the same indicator window
(Main W_RVIM and W_RVIM signal line)
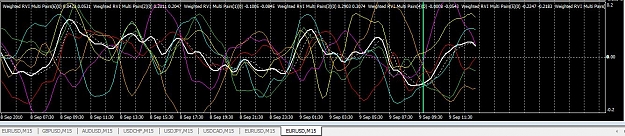
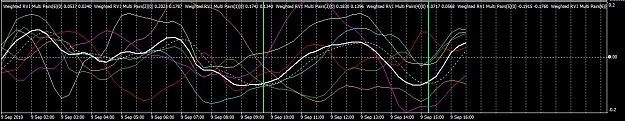
Long trade:
Vertical line (LimeGreen)
Main W_RVIM line and W_RVIM Signal Line below the horizontal zero line
The main W_RVIM line (white) is crossing up the W_RVIM signal line (dotted white)
Look also at the individual pairs.
Examples: see pictures
eTrader
Another method is using the indicator W_RVIM as a normal RVI indicator for each pair.
-Open eurusd chart TF M15
-place the W_RVIM(10) indicator in the indicator window
-drag and drop the other W_RVIM indicators in the same indicator window
-adjust the W_RVIM indicators:
(Fixed Min, Fixed Max/NumberPairs /Pairs1,2,3,4,5,6 /colors/ Levels (0)
-Place the indicator W_RVIM(10) in the same indicator window
(Main W_RVIM and W_RVIM signal line)
Long trade:
Vertical line (LimeGreen)
Main W_RVIM line and W_RVIM Signal Line below the horizontal zero line
The main W_RVIM line (white) is crossing up the W_RVIM signal line (dotted white)
Look also at the individual pairs.
Examples: see pictures
eTrader
Attached Image(s) (click to enlarge)