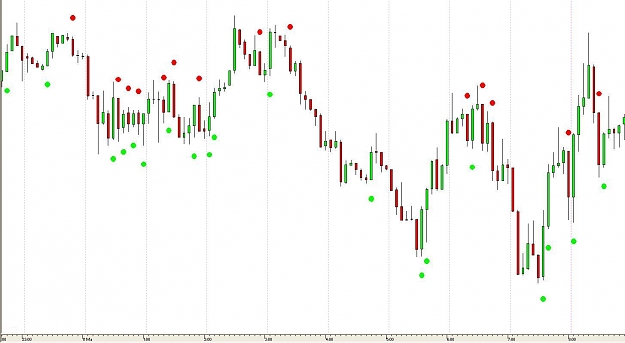
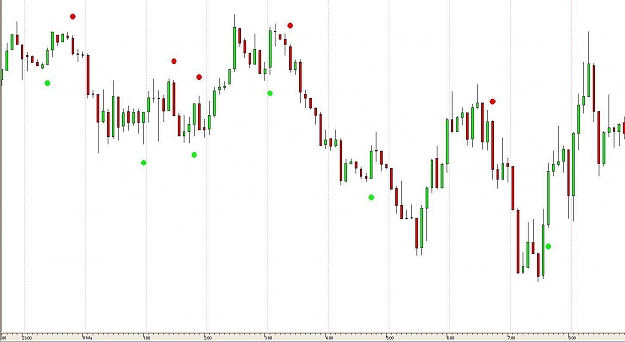
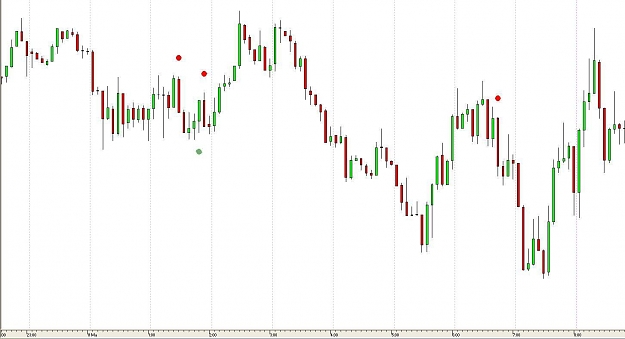
I've been using some proprietary software to view GBPUSD and it gives signals in the form of red and green circles. The signal can be adjusted in sensitivity, ranging from 2 to 20. I've attached 3 screen shots, showing intensity 5, 10 and 15. There were no signals on intensity 20.
Can anyone help to replicate (or approximate) this signal? The software coder has talked of his enthusiasm for RSI so it might be based on that. The software can display RSI and Dynamic RSI.
The shots are GBPUSD, taken for ~ the last 10 hours, 11th May 2010, UK time, 5 minute candlestick charts.
Any help greatly appreciated!
Attached Image (click to enlarge)
Attached Image (click to enlarge)
Attached Image (click to enlarge)