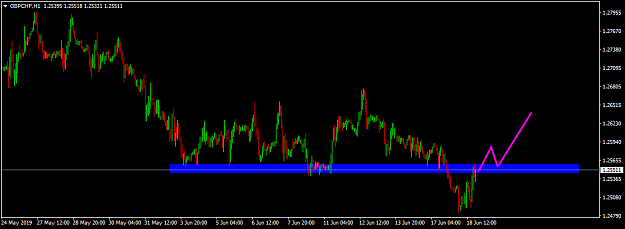
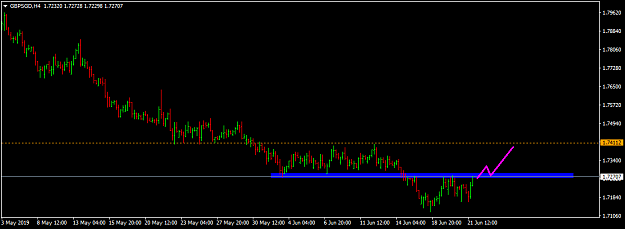
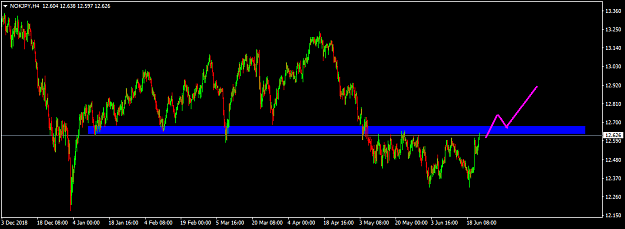
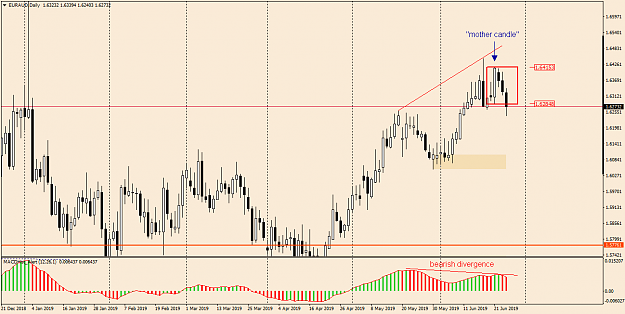
Legend: Arrows usually denote stop movements and targets. Horizontal blue marks watchzones and levels. Vertical blue markings are usually setups. Price tags denote entry prices and stop prices as well as eventual exit prices.
Everything should be understandable through context.
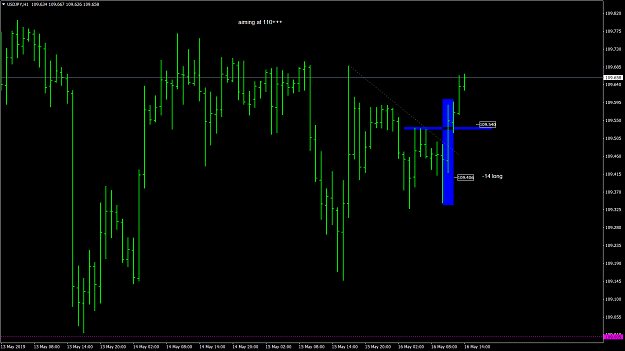
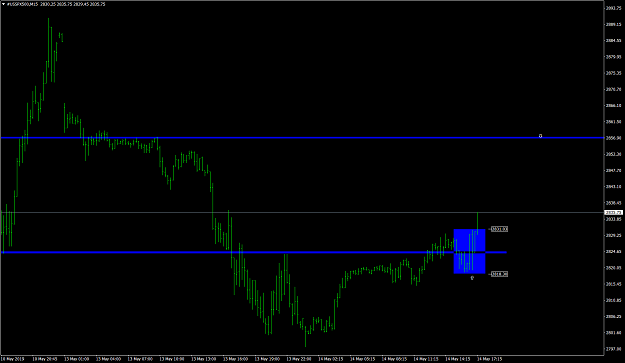
S&P long trade from the 14th of May 2019
Here I was watching the 2825 area for a push above and retest.
We fudged through the level a bit, but then stabilized and created a bullish engulfing pattern highlighted here in blue vertically.
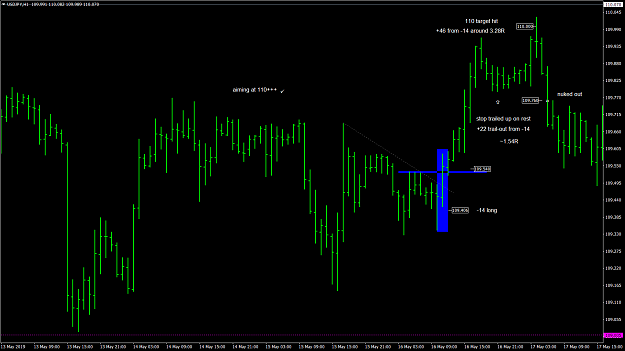
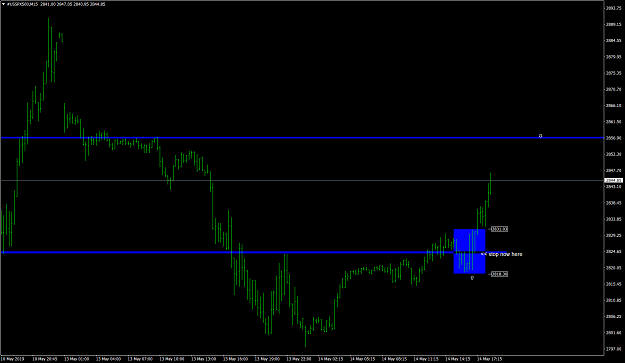
After that it was just about trade management and trailing the stop.
We failed 6-7 points ahead of target and the trade trailed out.
Everything should be understandable through context.
S&P long trade from the 14th of May 2019
Here I was watching the 2825 area for a push above and retest.
We fudged through the level a bit, but then stabilized and created a bullish engulfing pattern highlighted here in blue vertically.
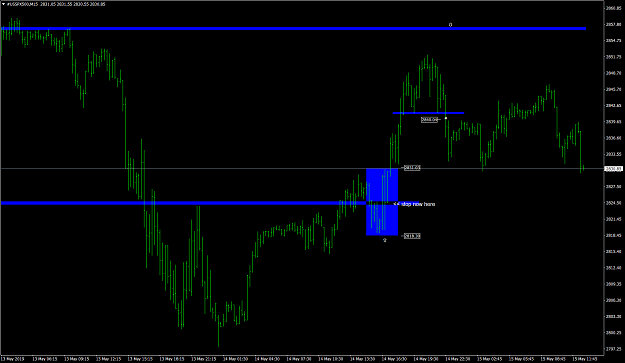
After that it was just about trade management and trailing the stop.
We failed 6-7 points ahead of target and the trade trailed out.
Attached Image(s) (click to enlarge)
Trust price. Know yourself.