|
Joined Jul 2006
|
Status: Pipping Tom
|479 Posts
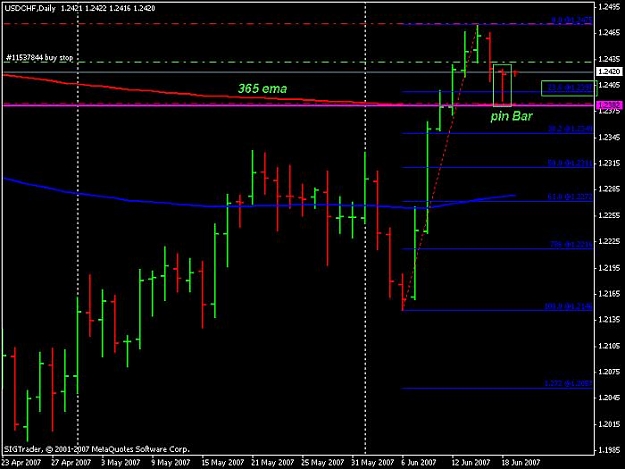
That's definitely an interesting pin.
This pair has been in an uptrend the last little while, and if you check the Weekly you can clearly see it's broken up through a descending trendline dating back a long while.
What do u guys think about this daily pin?? any takers? I will personally wait for a break and see then.
Cheers
Matias
Ignored
Last week EURUSD W1 & USDCHF W1 are PBs, eventhough USDCHF is not as good as EURUSD,
Yesterday EURUSD D1 didn't have PB, but USDCHF D1 has conflicting PB, I would go with weekly PB, which is short, because both weekly EURUSD and USDCHF show PBs and they are negative correlated.
And possibly EURCHF D1 will make retracement after stong move, this will make CHF stronger, which supports shorting USDCHF.
|
Joined Jan 2007
|
Status: Feed The Piggy With Pips!
|1,772 Posts
Thanks for the reply ademac. I think what I'll do is close some lots at certain smaller targets(such at 25pips or 40pips) and let the last one run with a trailing stop. But I'll also check that last lot each day to see if I should get out at a support/resistance level or not.
I noticed you mentioned "bar counts" but I'm not familiar with that term. Can you tell me a little about those? Thanks.
211,
I reckon you have hit the nail on the head "Exits" Not much thought is given to how to get out of the trade but loads on to how to get in. It took me a while to settle on my approach (I use a bar count). A few ideas you could look into would can be.
Risk to reward ratios
Bar counts
Trailing stops
Fixed targets
support and resistance
As you guessed you will have to work it for yourself, some help might be if you are a trend trader then go for something that will keep you in the trend while it lasts. Or a swing trader might target the last swing high or low of the pair as a place to exit.
|
Joined Jan 2007
|
Status: Feed The Piggy With Pips!
|1,772 Posts
Thank you for replying and giving me some great input and guidance. I think I am coming up with a strategy that will work for me and my goals using the info all of you have supplied. Time will tell with some testing and trading! Happy Trading!!!
Ok look at your post and you will se that you have answered your own question
Seriously though... Ademac has touched on this pretty well so I will just tell you what it is that I do.
I actually grade each one of my trades and based on the grade determines if I trade multiple lots and scale out or one lot and shoot for a specific target.
A trades get 3 lots which total no more than 3% of my trading account. B trades get 2 and C trades get 1.
Additionaly as the grade of the trade steps down each lot is only worth 1% of my account value.
Thanks for the reply ademac. I think what I'll do is close some lots at certain smaller targets(such at 25pips or 40pips) and let the last one run with a trailing stop. But I'll also check that last lot each day to see if I should get out at a support/resistance level or not.
I noticed you mentioned "bar counts" but I'm not familiar with that term. Can you tell me a little about those? Thanks.
Ignored
Its my preferred method of exiting. All i do is count back 1 bar and +/- 10 pips + spread from the high/low and set my stop there. then each day i move it to the previous days high/low +/- 10 pips + spread.
The concept behind doing it this way, is the old traders adage "Cut your losers short, and let your winners run." I have found that it gets me out of most trades that end up losers for less than my 1% risk, it averages about 0.35%. This works for me as i am still a young trader and i need to preserve my capital as i get better but at the same time allowing me to catch a big trend that builds your account.
I know other traders that use a 2 bar count on the 4hr, so if you look into this kind of approach then back test it to see how it performs over time. and what your tolerance levels are as it may take 3/4 days before it get to break even some times, the general minimum is 2 days to break even or better
|
Joined Jan 2007
|
Status: Feed The Piggy With Pips!
|1,772 Posts
Ok, I think that makes sense. So if you are long on a trade, you would set your stop 10pips+spread below the previous day's bar? And if you were short, you'd put it at 10pips+spread above the previous day's bar?
If that's right, what do you do on Sunday's bar since it's usually small? Disregard it? And what if Friday's bar is also small because it's not a full trading day? Thanks!
Its my preferred method of exiting. All i do is count back 1 bar and +/- 10 pips + spread from the high/low and set my stop there. then each day i move it to the previous days high/low +/- 10 pips + spread.
The concept behind doing it this way, is the old traders adage "Cut your losers short, and let your winners run." I have found that it gets me out of most trades that end up losers for less than my 1% risk, it averages about 0.35%. This works for me as i am still a young trader and i need to preserve my capital as i get better but at the same time allowing me to catch a big trend that builds your account.
I know other traders that use a 2 bar count on the 4hr, so if you look into this kind of approach then back test it to see how it performs over time. and what your tolerance levels are as it may take 3/4 days before it get to break even some times, the general minimum is 2 days to break even or better
Ok, I think that makes sense. So if you are long on a trade, you would set your stop 10pips+spread below the previous day's bar? And if you were short, you'd put it at 10pips+spread above the previous day's bar?
If that's right, what do you do on Sunday's bar since it's usually small? Disregard it? And what if Friday's bar is also small because it's not a full trading day? Thanks!
Ignored
Sunday bars i ignore and Fridays i treat like a full day. I live in OZ so my trading week parallels my working week. so it starts Monday morning on my way to work and finishes when I'm getting home from the clubs Saturday morning.
Its my preferred method of exiting. All i do is count back 1 bar and +/- 10 pips + spread from the high/low and set my stop there. then each day i move it to the previous days high/low +/- 10 pips + spread.
Ignored
hi Ademac, wouldn't it make more sense to correlate it to a daily range? 10 pips cushion means a very different level on protection on EUR/GBP and EUR/JPY, for example. What do you think?
|
Joined Jan 2007
|
Status: Feed The Piggy With Pips!
|1,772 Posts
I am still long with my last lot. I was going to see how the e/u reacted around the 3480 area(I have a trendline and Fib level there), but it looks like it's meeting some good resistance in the 3410-20 area.
hi Ademac, wouldn't it make more sense to correlate it to a daily range? 10 pips cushion means a very different level on protection on EUR/GBP and EUR/JPY, for example. What do you think?
Ignored
I agree i would make more sense to use some sort of daily range solution, but at this stage i am simply working with what i have researched and tested so far. When i have completed my latest round of back testing i will look into it some more.
|
Joined Jan 2007
|
Status: Feed The Piggy With Pips!
|1,772 Posts
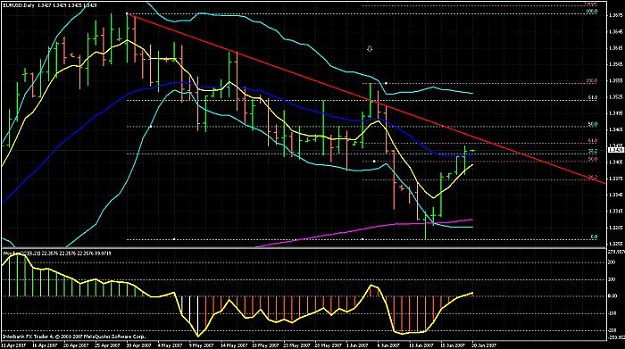
Just wondering if I'm recgonizing this pattern correctly, but it appears to be a dblhc on the eur/usd daily chart with a bottom bounce off/near the 38% Fib level. If that's right, then one would look to place a buy order 10pips+spread above the last daily candle according to the rules?
Anyone have anything else to add or correct me if I'm missing something?
Ignored
yep this is a DBLHC, if you decide this is a bar you want to play, you can play a break on the current bar, or if you want to play a retrace you can do that also(depends on the trader/plan)
Just wondering if I'm recgonizing this pattern correctly, but it appears to be a dblhc on the eur/usd daily chart with a bottom bounce off/near the 38% Fib level. If that's right, then one would look to place a buy order 10pips+spread above the last daily candle according to the rules?
Anyone have anything else to add or correct me if I'm missing something?
Ignored
OK here is my 2 cents on this one.
Although there is a DBLHC on this pair the current daily trend is down as indicated by the RED trend line.
Now that we are in a down trend we see that this pair has retraced back to the 61.8 Fib of the last reference high and to the 38.2 of the High point of this new trend. Now I am no expert but I would be leary of taking this signal long.
However as you have and Mike have indicated you could play this with an entry +10 + spread above the high of the last bar which should keep you out of a false break to the upside.
Steve
Ignored
Just wanted to add a note. Everyday almost you will find PA setups. Some better then others. It is your job as a trader to decipher what fits into your trading plan. What is your trading plan? Ah the big question. Everyone will have different plans. But this is the crucial part to being succesful long term. When one is first learning to recognize chart patters, and PA, I definitley suggest just going through charts and being able to read them back to front. So maybe play this DBLHC, to get a feel for price, but this doesn't mean to trade it on a live account. This is where James suggest demo trading for 3+ months(in the positive), before throwing money at it.
When I look at the euro, my entry was, and still is the Pin bar off the 150. Getting in now, is getting in late IMO, and it is better to wait for a better opportunity. So now for me, I use this DBLHC, as the next set of information into my current trade. Normally I wouldn't move my stops up, but since we had this TBL/DBLHC I will move my stops up to under this point. So although I didn't use this particular bar(not that you couldn't) as your entry, I still use it as information to my exit(extreamly important). And if you wonder those in the PF know I don't like to outright take profit, I am a trailing stop type guy.
|
Joined Jan 2007
|
Status: Feed The Piggy With Pips!
|1,772 Posts
Thanks Trader V. Just thought I'd put my 2 cents in again. I agree we are in a downtrend at the moment in the eur/usd...I have a similiar trendline like yours on my chart. But we are in an "overall" uptrend according to the weekly and monthly charts. Didn't know if you had looked at those charts yet. Just my thoughts, this daily downtrend is simply a correction of the overall uptrend. I could always be wrong though. Time will tell.
Although there is a DBLHC on this pair the current daily trend is down as indicated by the RED trend line.
Now that we are in a down trend we see that this pair has retraced back to the 61.8 Fib of the last reference high and to the 38.2 of the High point of this new trend. Now I am no expert but I would be leary of taking this signal long.
However as you have and Mike have indicated you could play this with an entry +10 + spread above the high of the last bar which should keep you out of a false break to the upside.