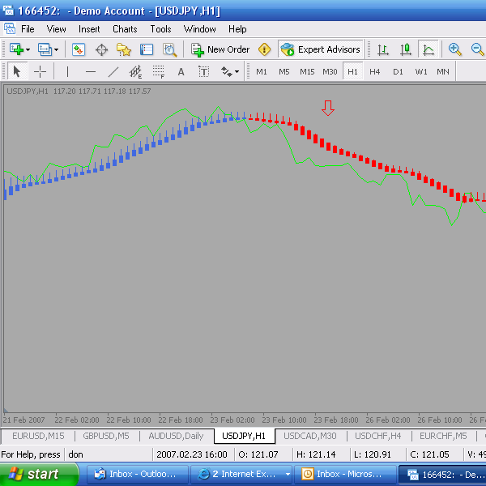
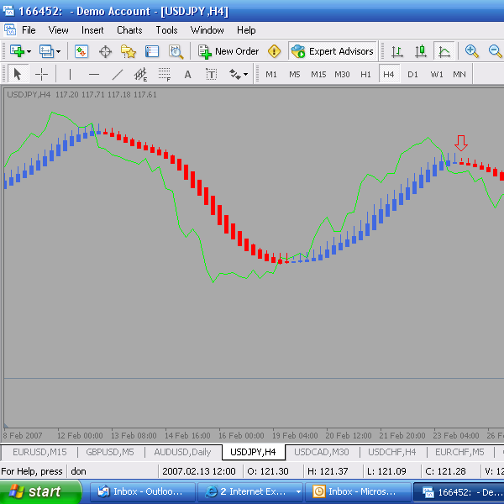
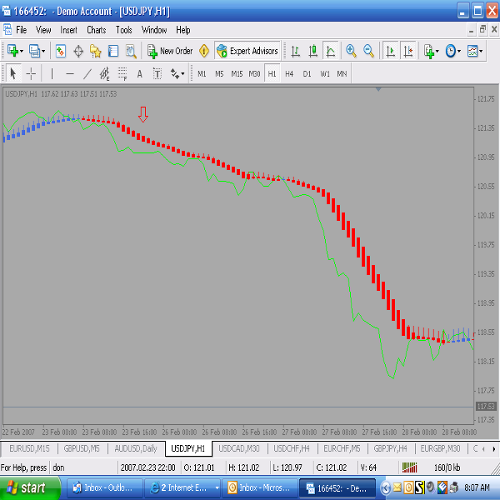
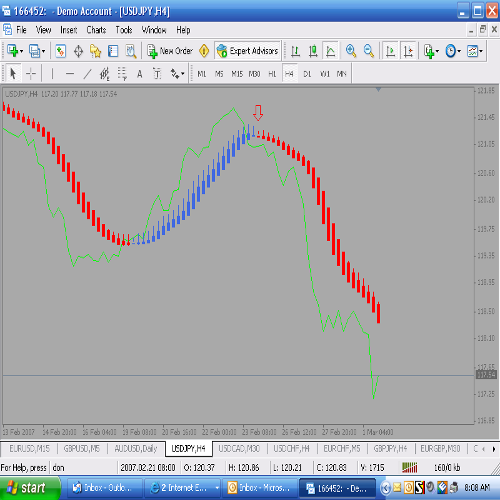
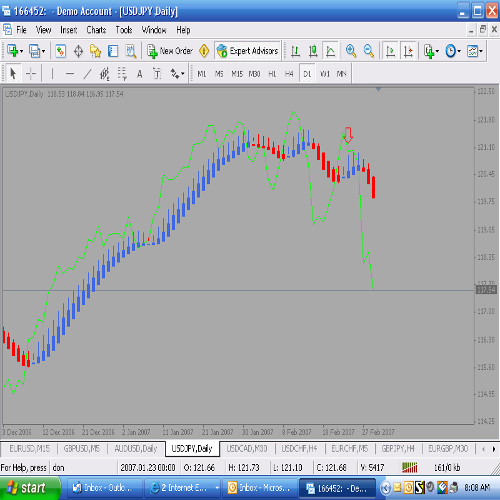
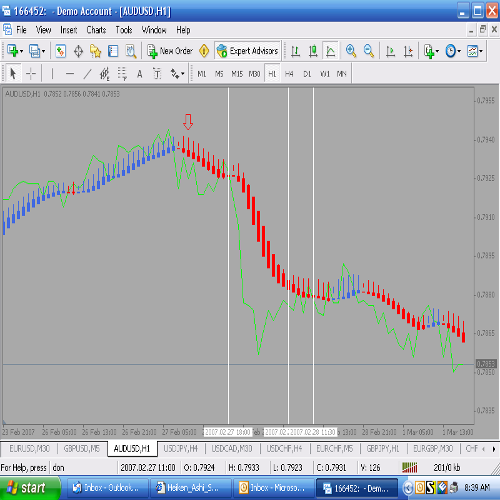
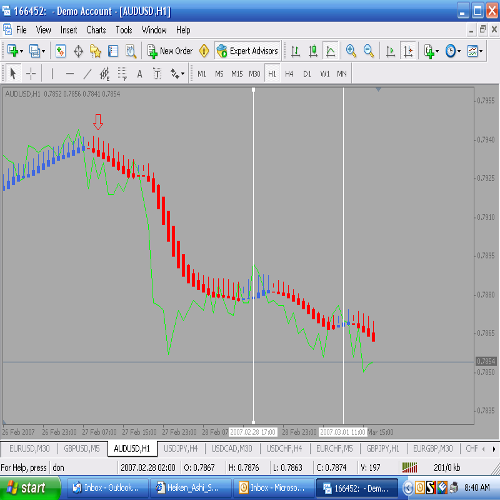
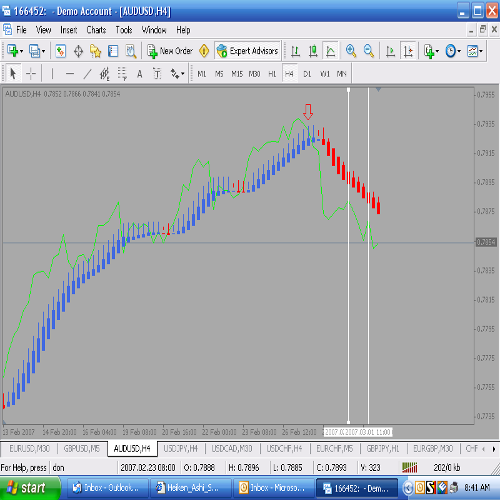
DislikedI am posting a screen shot of the wick length of the Heiken_Ashi_Smoothed indicator. The reason I am asking these questions is I think this indicator is about as close to the "holy grail" as I think I will find!
It is truly an amazing method to rid the whip saws and keep you in a trending trade. If not for finding this indictor I was ready to throw in the towel.
I thank the developer of this smoothed indicator and the author of this thread!
Now for my questions.
1. Obviously a bigger candle body a bigger move but what does the upper wick tell us about the trend strength?
2. Why are there so many upper wicks compared to almost non-existent lower ones?
Any help would be greatly appreciated!!!!!!!
Steinitz
Attached Imageshttp://www.forexfactory.com/attachme...1&d=1172579069
Ignored
Thanks for your input, and explanation. A couple of questions if I may.
1) You refer to three timeframes, but largely for entry you reference two and use the third and longest timeframe for 'possible' exits. Have I understood that correctly ?
2) What StopLoss do you generally set, presumably this will depend on what timeframe you are trading off ?
I like some of the mehodology you have talked about, particularly the multiple TF's, and I agree with others in this thread, its probably the multiple TF that is giving you the edge.
Good luck to you.