Ronin2002, I'd love your take on this...on how am reading this and what you think.
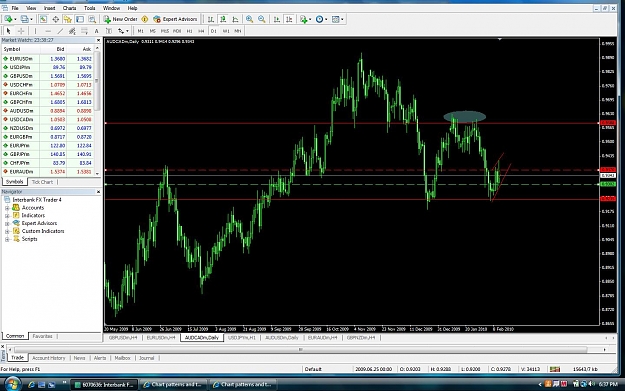
Ok, daily chart first...price coming down from a double top and flag forming after retesting support level..
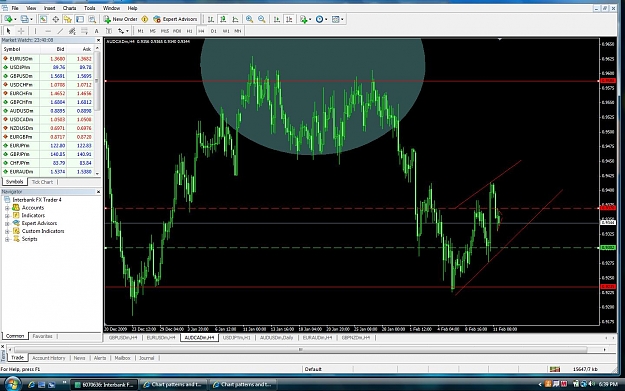
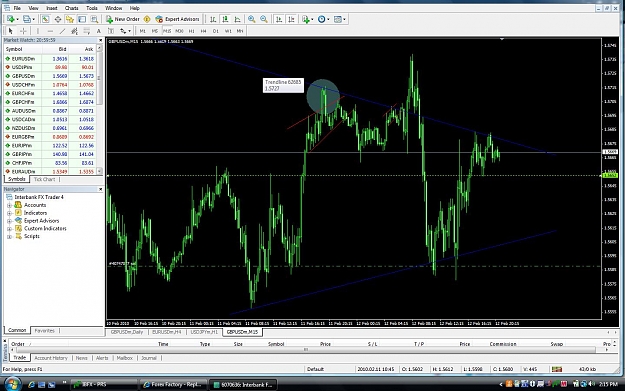
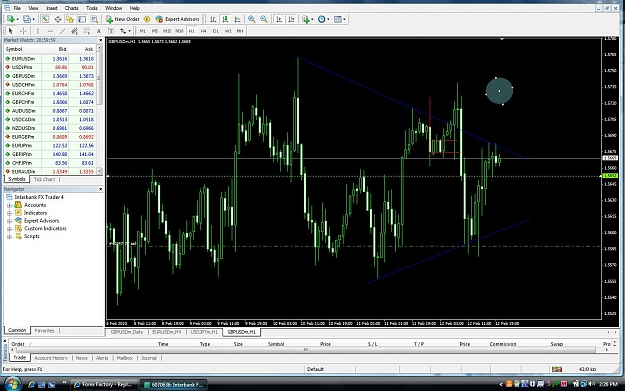
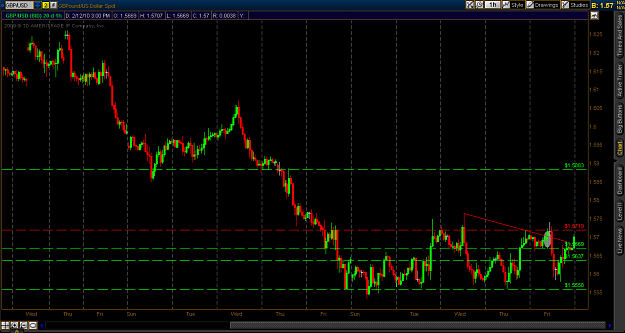
4 hr- bear in mind , these are the same lines from the daily , its the same chart and didnt want to over kill with lines but basically price on the way down from an ascending channel and possibly forming a bearish pennant..
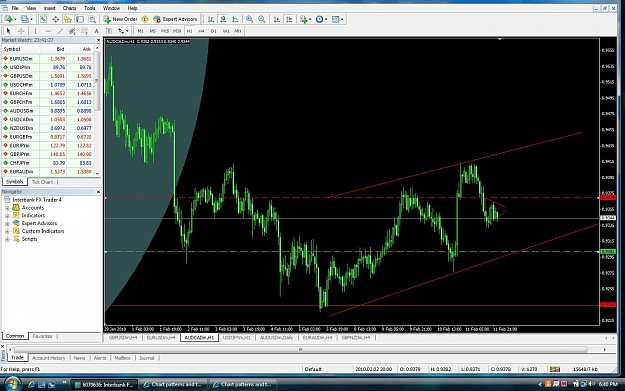
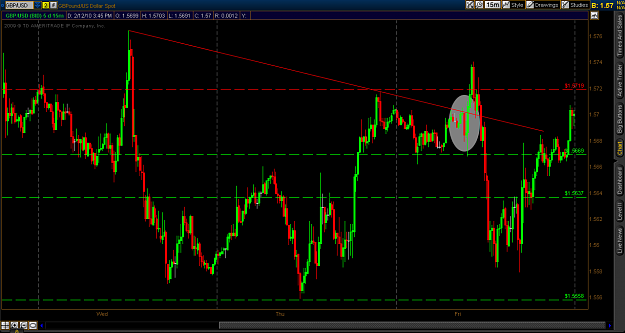
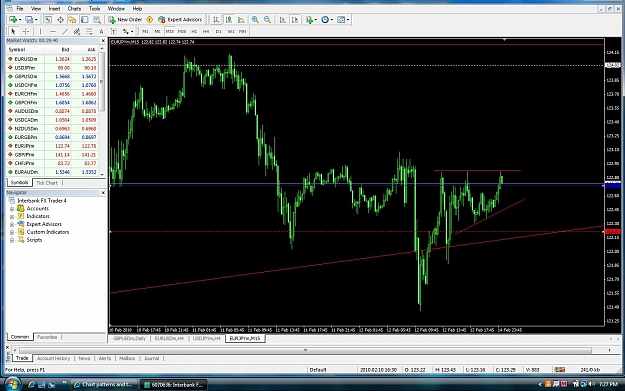
hr.1--if and when price closes below support of triangle...go short...red horizontal line would be my sl and green horizontal line my target...
Looking forward to your reply...
Ok, daily chart first...price coming down from a double top and flag forming after retesting support level..
4 hr- bear in mind , these are the same lines from the daily , its the same chart and didnt want to over kill with lines but basically price on the way down from an ascending channel and possibly forming a bearish pennant..
hr.1--if and when price closes below support of triangle...go short...red horizontal line would be my sl and green horizontal line my target...
Looking forward to your reply...
Attached Image(s) (click to enlarge)