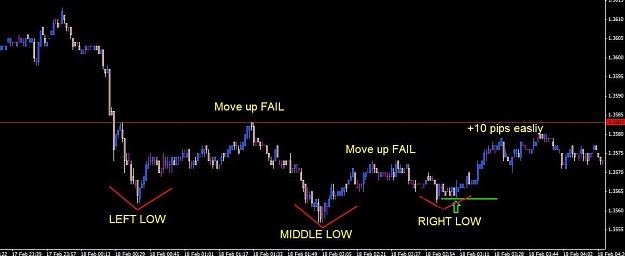
Now you can look back on the 15 min chart and see the move to 1.3495 area was the low in the middle of the stall pattern that occurs many times over and over.
How to identify the bottom areas.
1. Market makes a low LEFT LOW
2. Market retraces upwards then pushes back to the same low, but usually a little deeper (5-15 pips) to give a MIDDLE LOW.
3. Market moves up again to find resistance and will make a move back to the low that is usually around the first LEFT LOW area. This is the RIGHT LOW.
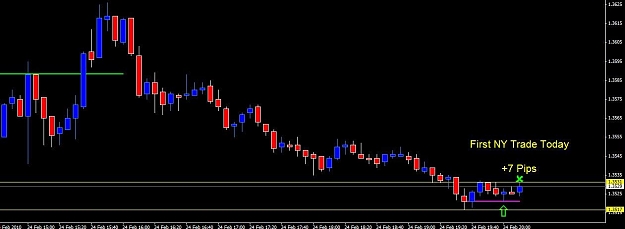
Okay, I just scanned the 1 minute and this setup popped out quickly.
You can see how I marked the setup, the red line shows the resistance that failed twice, and the support that set up after the Middle Low formed.
You have to be expecting the RIGHT LOW to stall and use the MIDDLE LOW as your stop, there are times these do not form, and you can lose, that is how trading goes, you win and you lose, just do your best to pick your areas.
I watch areas, then I can identify the patterns on any time frame, they all work.
I recommend trying to watch 1/5/15 all at the same time to try to identify how each candle works within the one higher.
I can tell on an hour chart what the 15 min candle is doing, and I can tell on a 15 min what a 5 min is doing and on a 5 what a 15 is doing, and so on.
I can look at a tick chart and see where the higher time frames have formed sup/res and formations, it is just time to give yourself screen time to recognize the where and when to trade.
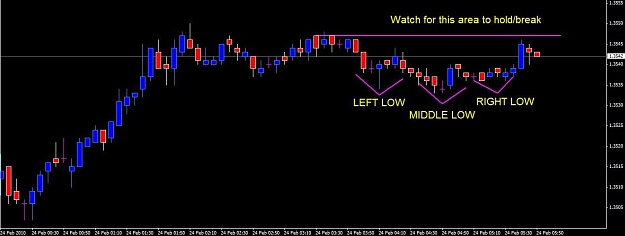
How to identify the bottom areas.
1. Market makes a low LEFT LOW
2. Market retraces upwards then pushes back to the same low, but usually a little deeper (5-15 pips) to give a MIDDLE LOW.
3. Market moves up again to find resistance and will make a move back to the low that is usually around the first LEFT LOW area. This is the RIGHT LOW.
Okay, I just scanned the 1 minute and this setup popped out quickly.
You can see how I marked the setup, the red line shows the resistance that failed twice, and the support that set up after the Middle Low formed.
You have to be expecting the RIGHT LOW to stall and use the MIDDLE LOW as your stop, there are times these do not form, and you can lose, that is how trading goes, you win and you lose, just do your best to pick your areas.
I watch areas, then I can identify the patterns on any time frame, they all work.
I recommend trying to watch 1/5/15 all at the same time to try to identify how each candle works within the one higher.
I can tell on an hour chart what the 15 min candle is doing, and I can tell on a 15 min what a 5 min is doing and on a 5 what a 15 is doing, and so on.
I can look at a tick chart and see where the higher time frames have formed sup/res and formations, it is just time to give yourself screen time to recognize the where and when to trade.
Attached Image (click to enlarge)