Please correct me if my analysis is not right. what I see is:
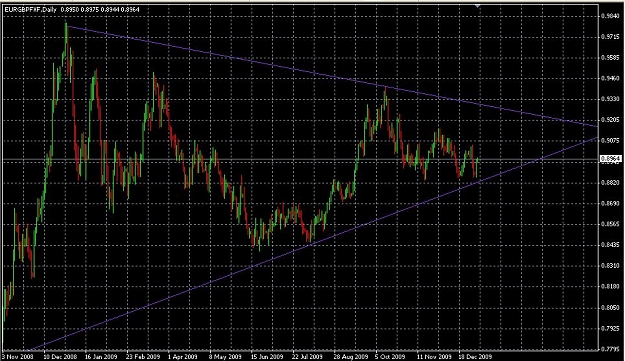
- 4H trend is down with price currently challenging UTL of lower channel.
- the 61.8% retracement of .8735-9325 comes in at .8960ish.
- Price has been rejected twice from supported turned resistance at .9091 twice in 2 days
- a clear break of .9091 will target upside at .9170 (support turned resistance)
- if .9091 holds, we are in for a ride down towards .8960 in next 6-8 4H candles (a day or two).
- A close above .9100 will confirm the break of downward trend.
Please correct me if my analysis is not right. what I see is:
- 4H trend is down with price currently challenging UTL of lower channel.
- the 61.8% retracement of .8735-9325 comes in at .8960ish.
- Price has been rejected twice from supported turned resistance at .9091 twice in 2 days
- a clear break of .9091 will target upside at .9170 (support turned resistance)
- if .9091 holds, we are in for a ride down towards .8960 in next 6-8 4H candles (a day or two).
- A close above .9100...
Ignored
Look at this lovely post..
If you carry on like this you will definately be smiling in the next 5-10 months....
Very good charts...I will start posting again on my own thread but there are some issues with full time posting as it interferes with current services if you know what I mean but will try my level best....
Well Done Puks
I wil try and post for a couple of pairs tonight...
Ignored
Thanks buddy.
I am just learning and hoping to pick up some ideas from your charts.
|
Commercial Member
|
Joined Mar 2009
|1,423 Posts
I am currently long based on the charts from 9020.. with a 15 point stop at 9015.. My Scalp Target is only 20 pips...( Trade Complete
2ND Chart Short Orders at 9070..
|
Commercial Member
|
Joined Mar 2009
|1,423 Posts
Times To Trade Full momentum normally does not hit before the European markets open around 06:00 GMT. Market sentiment runs in waves, 24:00 GMT (Japan), 06:00 GMT (Germany), and 11:00 GMT (Chicago), and outside of those times a forex trader is unlikely to see too much sustainable movement.
Global Forex Order Flow Times, And Regional Percentages:
U.K. and Euro-zone 52.6% (05:00 GMT-15:00GMT) Asia 21.1%. (22:00 GMT-07:00 GMT) U.S. 16.6% (11:00 GMT-20:00GMT) Other 9.7%. The above is the International Bank for Settlement numbers that analyze the global flow of forex trade. It reveals the reason that we do not expect too much to happen, (and we are usually correct), from 14:00 GMT until at least 23:00 GMT. It also reveals why the European futures market open, from around 05:00 GMT through until the Chicago reversal at 11:00 GMT are the main times to expect sustainable moves.
New Orders
For maximum forward momentum look to place/instigate new orders around the following times:
03:00 GMT (Tokyo return from lunch) 06:00-07:00 GMT (European Open) 09:00-11:00 GMT (U.S. futures reaction to London oil, gold, and Libor fixings)15:00 GMT (European close)
Bonds, equities, futures, commodities, all dominate in the U.S. session and as a result forex values are pulled from pillar to post as major global markets wind down their trading day just as the largest commodity, bond and stock markets get go from 11:00 GMT. That is the reason that we do not expect too much to happen, (and we are usually correct), from 14:00 GMT until at least 23:00 GMT.
18:30 GMT (Nymex oil market close) The 18:30 GMT time-frame is the exception to the rule, most days anything placed at this time will not follow through too far, and will very likely drift aimlessly through until swap interest at 21:00 GMT. If traders are looking to get involved in this period it should be done with reduced lot and only if the S&P market is moving hard. 20:00 GMT through to 24:00 GMT is a an absolute no-man's land of forex movement. Anything new that is loaded outside of these times may not follow through with great momentum. We will not be looking for anything other than Asian session drift trades at that time. Existing open alerts will be managed so that these low liquidity times are not an issue to potential follow through. The trade book will be closed for new orders from 15:00 - 24:00 GMT.
1st Trade in on UJ@ 90.19 with a stop at 89.70 according to the chart
Ignored
That was pretty easy...
Stop moved to break even +1 ie 90.20
Current Price 90.51 Running Profit is +30...
We have also broken 90.35 which means ...we could see atleast 50 pips in the basket on uj
Hi Geppyg - isn't it funny what a H4 chart will do to us in terms of perspective?
I am short at 1.4721 (H4 open under TL) stops at upper white line TP at lower white line. Just a quick 1:2 trade during London last night that decided to go absolutely nowhere so far. Also holding long GBPCHF and short USDCHF.
Retail traders are rediculously long this pair. I want to see them get squeezed!
Hi Geppyg - isn't it funny what a H4 chart will do to us in terms of perspective?
I am short at 1.4721 (H4 open under TL) stops at upper white line TP at lower white line.
Ignored
Buddy..You have a valid trade..My Trade is only valid once the UTL as mentioned is broken...The Reason I still would not go short is because...we are still playing in the 4 hour triangle....
I am failing to understand your chart...mate..as my Trendlines look nothing like yours..hmm
Are you trading a 4 hour chart..or another time frame ?
Regards
Mate you have some wierd charts..I have checked all time frames and not one time frame upto daily suggest what your chart suggests.....
In general I chart candles to the point so there is no mistakes for my TL's
Be Careful with you shorts...unless you are scalping....
Short squeeze mean buy at discount for me....
I am failing to understand your chart...mate..as my Trendlines look nothing like yours..hmm
Are you trading a 4 hour chart..or another time frame ?
Regards
Ignored
Sorry Geppyg - should have clarified - I use "Mouteki" otherwise known as "Level 2 Tom Demark" trendlines. Each supply/demand point must be a fractal and you read the chart from right to left looking for only the most recent information to draw your lines. This gives a fully consistent - quantified method to draw trendlines - i.e. it eliminates subjective ideas from trendline drawing and allows me to trade them mechanically.
Sorry Geppyg - should have clarified - I use "Mouteki" otherwise known as "Level 2 Tom Demark" trendlines. Each supply/demand point must be a fractal and you read the chart from right to left looking for only the most recent information to draw your lines. This gives a fully consistent - quantified method to draw trendlines - i.e. it eliminates subjectivity.
Trading H4 only on this pair.
Ignored
Clever sod i have difficulty reading charts from left to right let alone right to left..Good Luck matey on your charts..
No Short for me yet..
Waiting to place a long probably about 1.4728..
Lets see..
Thanks for taking the time to post your charts and trades...
Lets see..
Thanks for taking the time to post your charts and trades...
Ignored
If we break and close the supply line I will cover shorts and go long. My feeling is there are too many retail stops at last weeks low to not get pushed by a tick or three - but like I said - the lines allow me to trade mechanically. My TP/SL is mathematically derived - TP just so happens to be at that low point!
Thankyou very much for your constant posting of charts and trades also - very much appreciated to see how others are playing along and their thoughts.
1st Trade in on UJ@ 90.19 with a stop at 89.70 according to the chart
Ignored
Stop has now been moved to break even
Current pips +31 Target is 91.15 and then 91.50
There is no risk to this trade as stop has been moved to break even after we get a close above 90.70 I will move stops to +20 and then trail to target or take profit..depending on trade circumstances