Hannover, nice work (I Think). The trouble is, when I load it on my chart, it loads successfully (with the settings you have suggested in one of your posts), and then as soon as the next Tick of information comes in, the indicator disappears. I am on a 5-digit borker if that makes any difference ?
I may however have answered my own question, if I remove my MTF_HI_LOW_V1 indicator, then this works OK.
Ignored
Glad that you found the problem. I have no idea why there should be a compatibility problem with any other indicator, unless the other indy is clearing objects (other than its own) from the chart, or both indys are creating objects with the same names.
Hanover ... you are pure genius my friend .. i am a developer by trade but my maths is so pathetic i could never attempt this type of thing
Now having said that , i am not quite "getting it" so i have a couple of questions.
Firstly, I have entered "D1" into the tf param as per my understanding when i go down to h4, only the D1 levels will still show ? However that is not the case - i may be missing something, but when i moved down to h4 i am getting LOTS more lines (as displayed)
Params i've started with are:
TF: D1
LookbackCandles: 400
BandwidthPips: 1
FreqLevels: 1,2,3,4
Visibility: 2,1
ClearancePips: 0.0
Secondly,
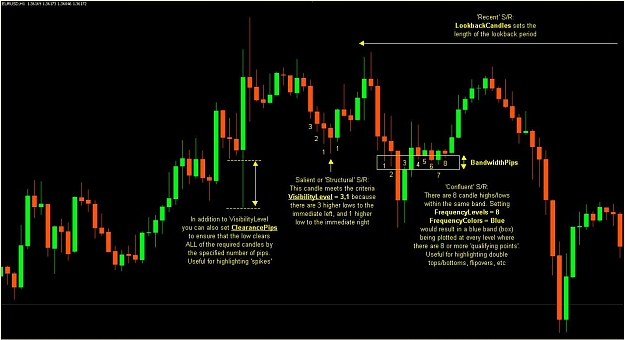
There is a post u have with an example of 3 sets of settings u call "Salient, Recent & Confluent". I'm sorry but i dont really understand the differences in the context of SR.
I would like to use this to auto-generate the SR levels on a daily level as you would ordinarily do by eye ... then go down to the h1/h4 and have those same daily SR showing.
I am playing with different settings but im just missing something
Firstly, I have entered "D1" into the tf param as per my understanding when i go down to h4, only the D1 levels will still show ? However that is not the case - i may be missing something, but when i moved down to h4 i am getting LOTS more lines (as displayed)
The most likely cause is that it's getting the parameters from the parameter file (..../experts/files/Presets---Recent SR.TXT), instead of those you've entered. Solution: type an X into the ParameterFile entry. Then the indy won't be able to find a file named X, which will force it to use the parameters that you enter.
There is a post u have with an example of 3 sets of settings u call "Salient, Recent & Confluent". I'm sorry but i dont really understand the differences in the context of SR.
"Recent": this is controlled by the LookbackCandles entry, i.e. how many candle highs/lows you want the indy to go back. e.g. if you enter 20, it will only plot bands at the levels of the highs and lows of the last 20 candles. Some traders (me included) believe that recent highs/lows are more likely to be respected than those from a long time ago. So this is how you define the "recentness".
"Salient": this is controlled by the VisibilityLevel parameter. Entering a higher value mans that only conspicuous candle highs/lows at the end of moves will have their levels plotted. e.g. if you enter VisibilityLevel = 2,1 then a candle high must have 2 lower highs on the candles on the immediate left, and 1 lower high on the candle on the immediate right, to have the level at its high plotted. Vice versa for candle lows. Enter 0 if this doesn't matter to you.
"Confluent": this is controlled by the FrequencyLevels entry. If you enter 1, there needs to only be 1 candle high/low within a band (the height of which is determined by BandwidthPips) for its level to be plotted. If you enter 2, there must be at least 2 candle highs/lows within a band, and so on, otherwise the level will not be plotted.
Everybody's idea as to what represents significant S/R is different, and you can adjust these parameters to suit your personal view. Read the Word doc (attached to post #1) for more info, and experiment until you find settings that suit you. If, for example, you want EVERY high/low of the last 100 D1 candles plotted (i.e. no filters for visibility or frequency), use:
ParameterFile = "X";
TimeFrame = "D1";
LookbackCandles = 100;
StartDateTime = "1971.01.01 00:00";
IncludeCurrentCandle = false;
BandwidthPips = 2.0;
FrequencyLevels = "1";
FrequencyColors = "Blue";
IncludeNextBandAbove = false;
VisibilityLevel = "0";
ClearancePips = 0;
CandleHighsValid = true;
CandleLowsValid = true;
CandleClosesValid = false;
AllCandlePointsValid = false;
FilledBoxes = true;
I just wanted to thank you for a great update with the new parameters. I'm finding the indi a great compliment to finding S&R levels by visual inspection.
I'm a big fan of market profile so I've been trying out the price histogram (which I didn't bother with before) and it's a nice way to look at the frequency distribution of price.
Many thanks for your generosity and hard work.
Ignored
Thanks likewise for the feedback. I'm glad that I decided to share the indicator.
|
Joined Jan 2010
|
Status: Slow and steady
|356 Posts
Hi Hanover,
I am interested to try your Recent_SR indicators.
There are 3 files in your post. While there is no problem to download the Instructions file (word file), the other 2 files, the Preset (txt) and the Recent_SR (ex4) gave me problems.
When I tried to save the problematic ones, the Open/Save window that pops up indicates that the File Name= attachement.php and the File Type = php_auto_file. Clicking on the 'save' button somehow opened up the Zip software prompting me to create a zip file. I am stumped!
Are you able to shed some light here?
Thank-you very much.
Latest update: version 1.01, uploaded February 1, 2010 Latest changes to this post in red typeface
Disclaimer: The attached indicator is supplied 'as is', free of charge. No warranty or obligation of support is implied. Download and use it at your own risk. I hope that you find it useful. It's the initial v1.0 release, please feel welcome to post questions, and report any bugs or shortcomings in this thread.
_____________________
I am interested to try your Recent_SR indicators.
There are 3 files in your post. While there is no problem to download the Instructions file (word file), the other 2 files, the Preset (txt) and the Recent_SR (ex4) gave me problems.
When I tried to save the problematic ones, the Open/Save window that pops up indicates that the File Name= attachement.php and the File Type = php_auto_file. Clicking on the 'save' button somehow opened up the Zip software prompting me to create a zip file. I am stumped!
Are you able to shed some light...
Ignored
Download from the paperclip top right - this problem is well known and has been answered 100's of times before ...
Thanks for your indicator. I trade daily charts based on Pin Bars as per J16.
I am trying to set up your indicator to show me just simple s&r lines,
in red, based on the last 200 bars. I would like the lines to touch the close of a candle rather than the top of the wick.
Could you please let me know the settings for this type of set up. I do not need to include anything else. Thanks for your time. Sorry to be a pain.
Regards
Glynn
I am trying to set up your indicator to show me just simple s&r lines, in red, based on the last 200 bars. I would like the lines to touch the close of a candle rather than the top of the wick.
Could you please let me know the settings for this type of set up.
Ignored
Glynn,
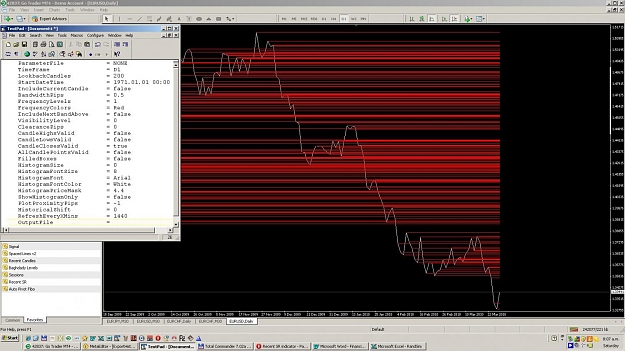
Please see the graphic below. The parameters shown will produce the chart shown. This is generating a line from the close of each one of the last 200 bars. I've switched to a line chart to show that the lines do in fact emanate from the candle closes, as opposed to highs/lows. I'm not sure if this is the outcome you were after, but it's based upon my interpretation of your request.
Please see the graphic below. The parameters shown will produce the chart shown. This is generating a line from the close of each one of the last 200 bars. I've switched to a line chart to show that the lines do in fact emanate from the candle closes, as opposed to highs/lows. I'm not sure if this is the outcome you were after, but it's based upon my interpretation of your request.