line patterns
Home of bsTL's from lots of candles: the definition(s) of l.c.'s
current theory (01302010):
The idea of logarithmic cycles gets broader every time I revise it. This time, I'm more able to stay in one spot (TF and distance between candles) instead of bringing in some far-flung notion.
Variables are 0- and 90-degree consideration (either with real price or time- or other unreal/empty approach), other-angle consideration (either with real price or time- or other unreal/empty approach), and random-point consideration.
Study variables are a range in shape detail from a recent journal post's detailed shape that results in pattern repetition, next to the already-known line and pivot that results in various spread patterns, and finally to a vague, condensed shape with an expansive, logarithmic-like shape so that they contrast and somehow react to each other, that results in a midline between the two.
Examples needs must abound for this to work. Here's one.
-----
last theory (12-09):
I'm using the phrase 'wave areas', which covers the 'logarithmic cycles' of this thread with 'wave' and 'shape areas' of 'EUR/USD Patterns' thread #61-2 with 'areas', to describe my new approach in the latter thread.
I stopped use of the name "logarithm" in reference to anything except an instance where it's apparent they're applicable, as with logarithmic curves (which is mathematical) or the old method below, since the current use is too math-like when the approach isn't. I can stand with the idea of shapes and patterns, since they're fairly vague and treated thusly, and since I've studied them a while.
-----
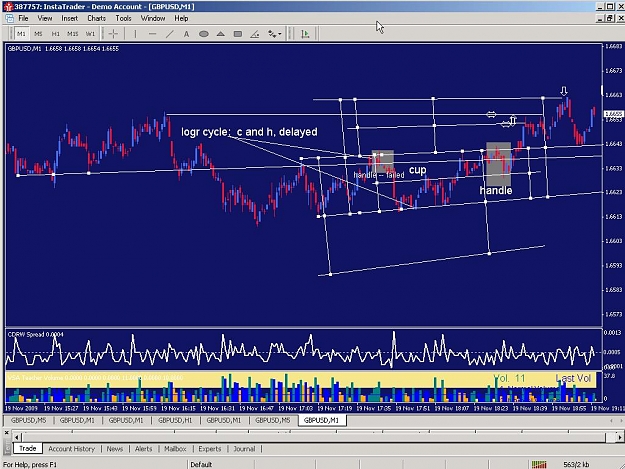
Below was an attempt to expand the use of logarithmic cycles from their original effectiveness, which is reading failed cup-and-handle formations, common with gbd/usd.
logarithmic cycles
This technical charting approach borrows from the idea of natural logarithms, which appear sometimes with a high-spread bar in its immediate area. The logarithmic cycle approach contains a general area which eventually creates a level and then its end, the dot.
A structured version of drawing logarithmic cycles is in post#7 and after the adaptable one below. A trader who uses drawing tools a lot may recognize Gann Fans on the dot or Fibonacci Time Zones in repeated shapes of logarithmic cycles.
Below was written to allow wider applicability for l.c.'s., in an approximate order of focus.
The reason for applicability variables can be understood with the first one.
Usually, another logarithmic cycle weighs in consideration for how the current one acts, sometimes one for whom the xy axes are extremely different. This can be a big challenge to the l.c. trader, and dependence on these l.c. variables increases.
The variable most used would be the loop variable, since it allows easy comparison of approaches.
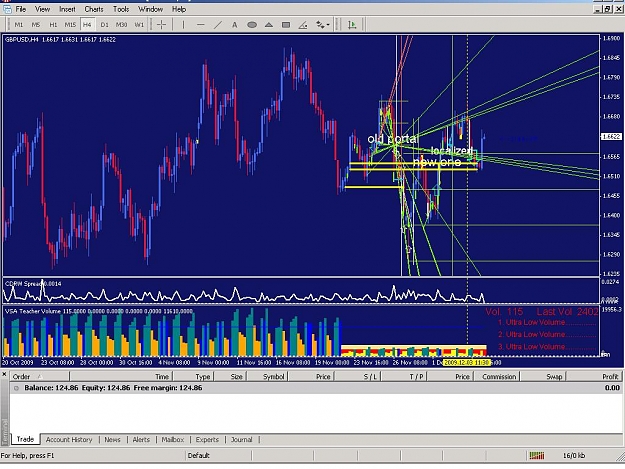
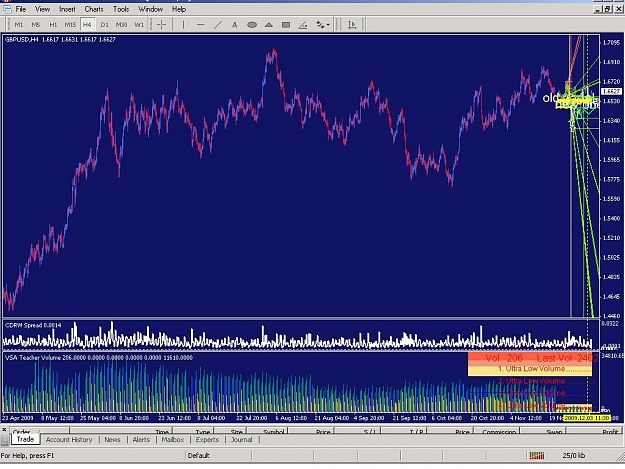
*The inter-logarithmic cycle variable measures proportion within what affects an l.c. and a sense of localism to globalism as to how much affects, where it is, what specifically contributes to the current l.c., and thus what l.c. the current area is actually in:
An easy way to think of it is in two variables,
the x- (horizontal) axis, which is time-based distance, how far away, or the width of, the affecting l.c. and thus its pieces is,
and the y- (vertical) axis, how big the affecting l.c. or a portion therein is versus the current one.
The general area of a logarithmic area has a couple of variables:
*size-of-loop variable, in which the chart is either a trend or an area,
repetition (reframing on and along the price-time line) increases the chance of a logarithm completing its shape,
and difference (anchoring, with projected, imagined TL's representing the cycle's excess energy influencing off of the price-time line) more about pieces of a logarithmic cycle.
*loop variable itself is a definition of trend and area, with allowance for them together being a range in terms of, and representing the majority portion of, a logarithmic area
WHAT
trend.................area...............with channels a compromise of these
TO DO
small groups.......spread patterns
FOR THE PURPOSE TO
reframe......anchor
.......for..................for
anchor afterward......reframing afterward
Then, there are the level and dot:
*level, which can be considered a variable in terms of use with its context and size varieties,
is conceptual if it is more trend than area, and thus has a highly contained (including rl, though with forex there's less use to note this feature of the) inner area;
and, it is definitional, that is, horizontal, if it is more area than trend.
*dot has area - trend varieties too, derivative of the above two portions of an l.c., with one specialty being that a balance line (optional) (a device of the small groups approach, upon which trend depends) may connect the spread pattern of the level the dot is related to, and another being that horizontal lines with the nearest pivot to make another such line parallel with, is the usual spread pattern (and thus area, which depends on it) used, tho on occasion the dot will include with itself enough near itself for a small-spread pattern.
The dot is often the central trade, since it's where the price-time line takes a 90-degree turn, with a conceptual variant in logic dot, where price doesn't return from a turn.
-----
12142009
A simpler way is to take balance lines and refine, with small groups, which lines to thread through the exit bar (which also uses shared hi/lo's from several candles, to determine the middle of a vertical wall and other areas with little to no balance shown). Then area bsTL's, which are balance lines for an entire area, or logarithmically progressive small groups, which are logarithmic cycles without the TL's, can be used interchangeably. Finally, this can be included, as it's based on vertical walls ending in small groups forming symmetric triangles. Oh, triangles and frames are also useful at this point, so shape areas may go with the balance lines idea.
Then you can wing the inter-l.c. variable, make a given (since balance line depends on level and dot implicitly) the level and dot, and make shape areas into the loop variable, leaving the core of the idea above, the loop (trend <- compromise -> area) itself; if price is churning within a small channel, you can see the logarithmic cycles at play, jump and withdraw one after another, and thus avoid having to make shape areas.
--------------------
logarithmic curves example, explained in an older way to find and use them --
Making a logarithmic curve:
1. Set vertical lines at news items on the 1'TF . Also note other time periods, such as Sunday open or inter-US/Asian slow period. One may want to try a small-spread pattern at a midline or two, to warm up one's impression of the area.2. Set vertical lines at significant turns in 5'TF patterns. Measure the vertical lines for a change in the gap width for the significant turns in 5'TF patterns that signify a possible logarithmic curve beginning.
3. Put same-spread bar channels approach, which is the foundation for trading with this method, onto a expanded 1' chart, looking for anything unusual.
4. Place trend centerlines with fitted midlines on a condensed 1' chart, several in a row until see how they shape the price-time line.
5. Look for a horizontal trend centerline. There will be some kind of spread pattern -- high, average, small, high with an average one, or high with a small one -- that the logarithmic curve depends on to finish at this point, and that also note direction after the logarithmic curve is complete.
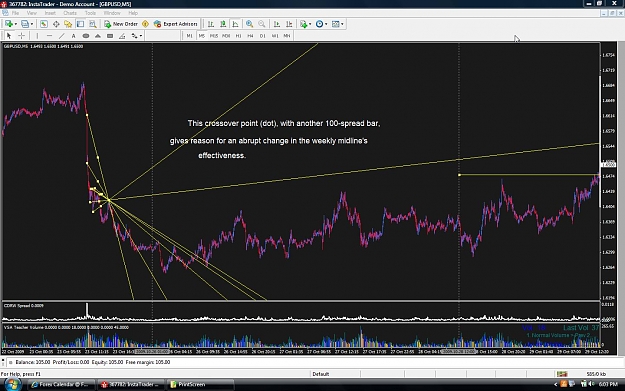
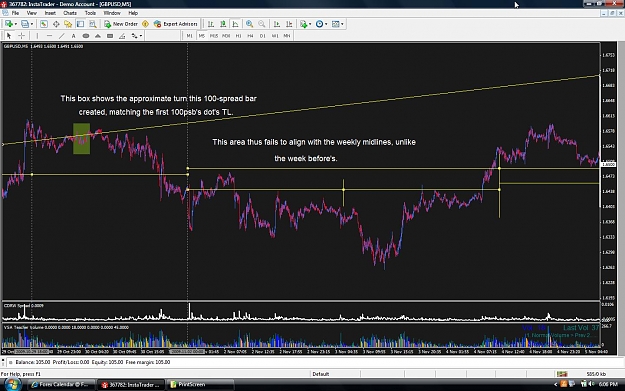
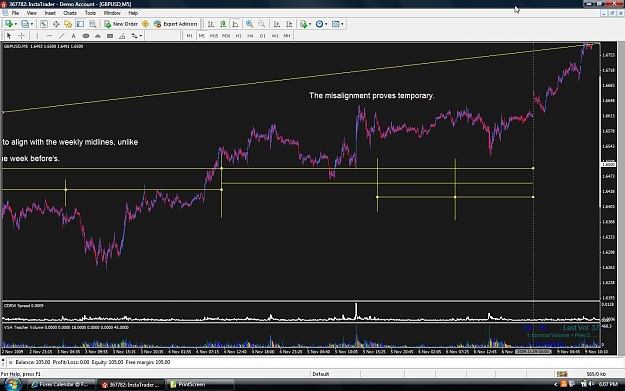
6. Once one arrives at a horizontal trend centerline, look for a possible logic dot after this, that is, a candle to which the price never returns in one direction for a long time. One trend centerline will align somehow with the logic dot: Figure how. This will take a bit of creativity, one that will match with the surrounding area. Also, see how different internews midlines fit around the logic dot suggested.
7. Draw the appropriate line(s) -- variously called balance lines, convergence points, crossover points, and other, depending on the spread pattern(s) used -- from the logic dot and from the spread pattern identifying it, to the limit of their effectiveness. Deviation lines tend to be numerous at this time.
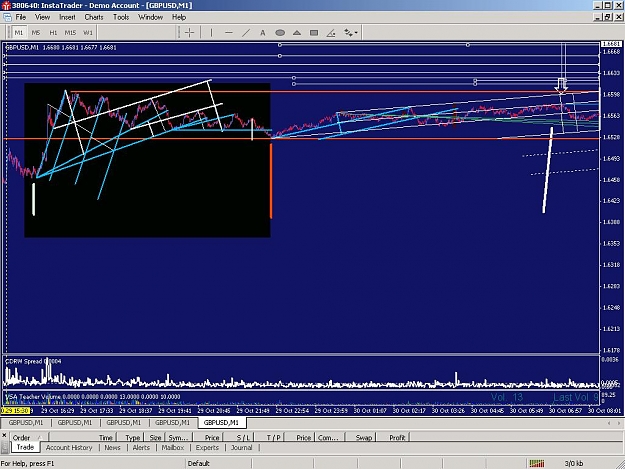
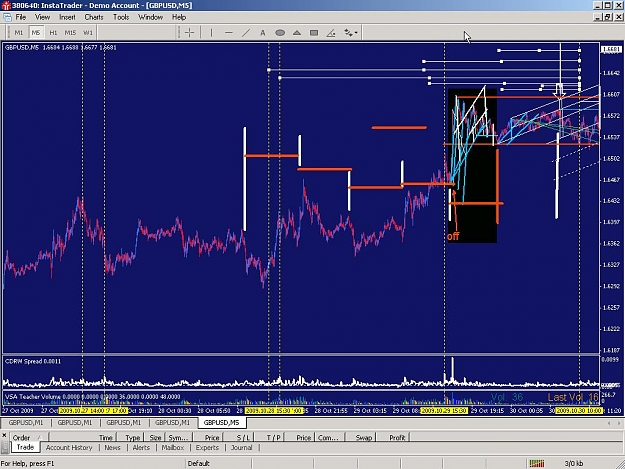
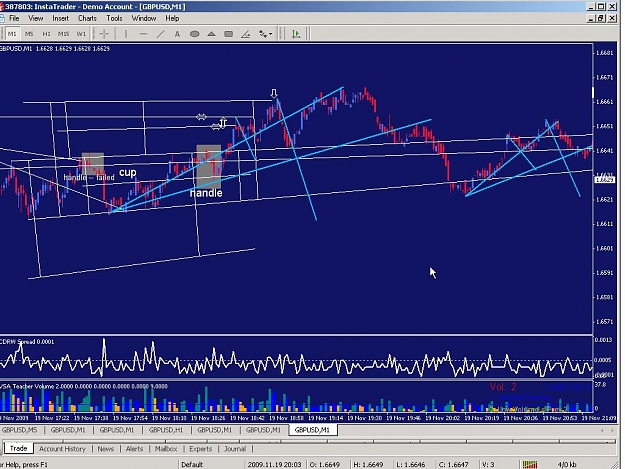
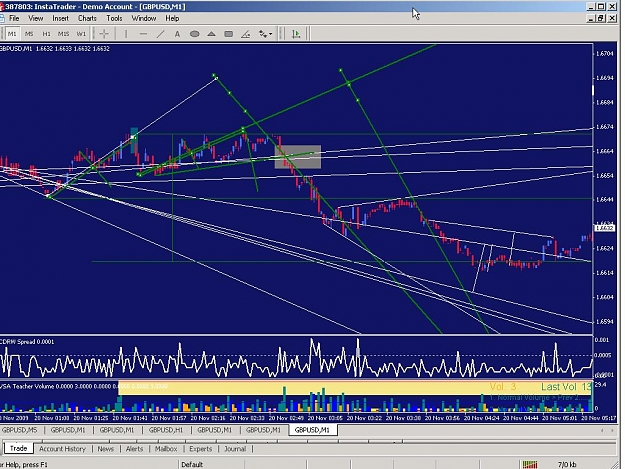
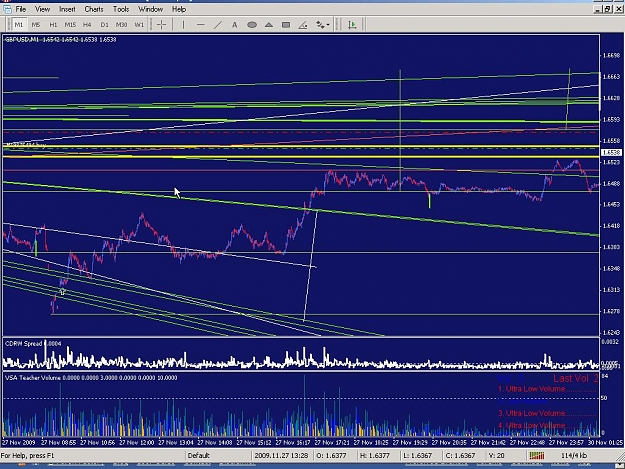
Here's an example of a logarithmic curve. Trend centerlines (left of the double, white TL's, in deep sky blue (the trend centerlines) and white (midlines)) cooperate with an average-spread pattern's bsTL's (the double, white TL's) to produce a convergence point (similar to a logic dot or crossover pivot; with a dropdown line (vertical TL in white) to candle below it,
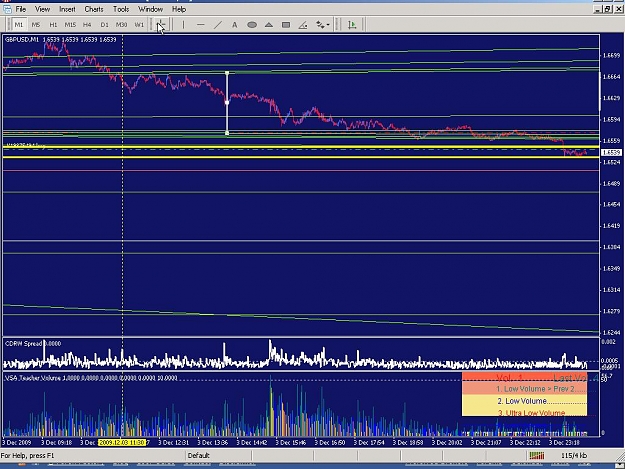
drawing a midline (and extensions from it) between the convergence point and the balance-point extension of the price-time line's fall that led to the convergence point's average-spread pattern (1,2,3,4,5,6,7,8,9,10) ) for one of these cycles:
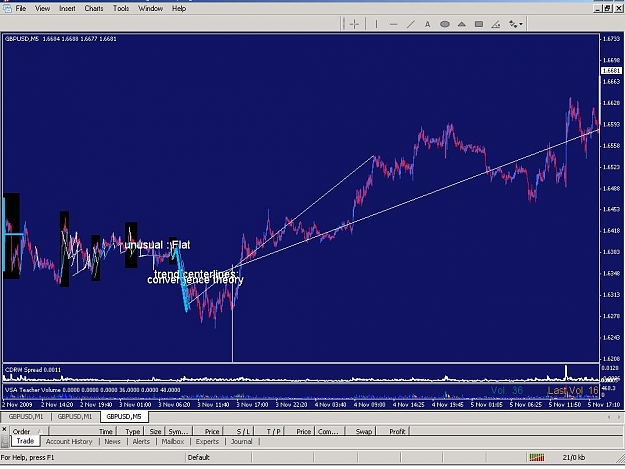
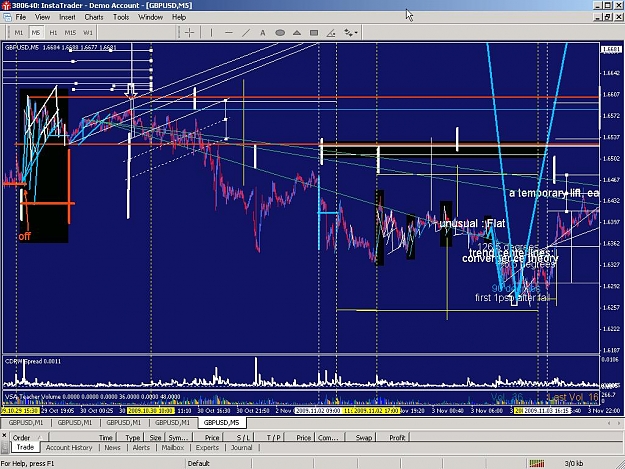
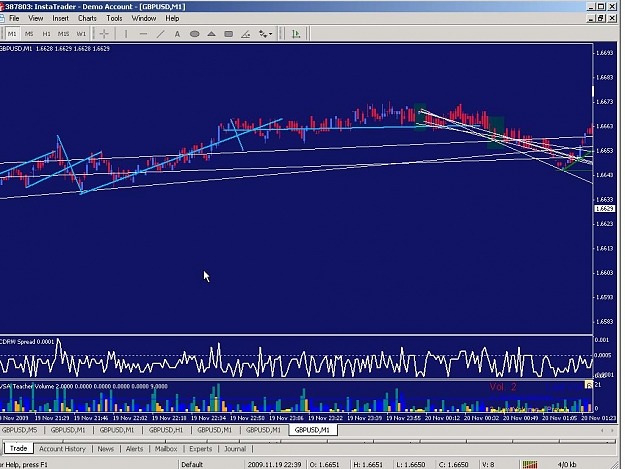
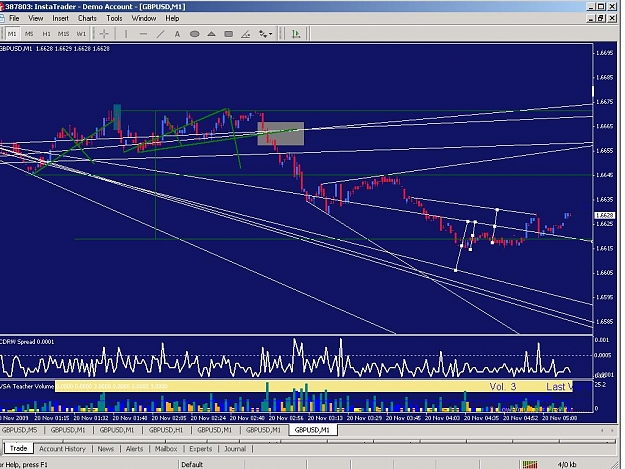
and its evolution (1,2,3,4,5,6,7) and follow-through (8,9,10,11,12,13).
(Why the thread's title: I first made trend centerlines, first made with moving averages to select them, which, in retrospect, approximates logarithmic curves, average-spread patterns' specialty:
The purpose of this thread is to discuss how moving averages replace and help drawing tools.
I've been seeing lots of interesting uses for moving averages: To show each cycle, to help channel a trend, to show consolidation areas, to give the center line of most price bars, and so on. Most of these substitute for drawing tools. Thus, it seemed reasonable to discuss different ways moving averages are used to substitute for drawing tools or (*) to use drawing tools with. Drawing regular lines to follow the PA can take a lot of time, and ma helps; on the latter, any extra edge that finds the next turn is appreciated.
*ex. ( http://i44.tinypic.com/dq28nc.jpg , http://i39.tinypic.com/27zllwh.jpg ) Take an 89sma and bars that show its time unit's entire range (hiekin ashi and other) and look for pivots that are reasonably close to each other so one can see or easily imagine a bar-laden trend between them on the 1'.
Draw a trendline between two of these pivots whose midline hits the 89sma exactly (having to move trendline around to close-by, smaller-run pivots) and also approximates a ninety-degree angle with the ma. Draw a trendline horizontally from the midpoint of the trendline just drawn, either using a ray or extending the line to the right as far as desired.
This horizontal ray is your centerline and usually hits paydirt when PA begins midlining trends on it (instead of the 89sma); one can draw midlines along a trend and on the centerline instead of the ma, to track the centerline's progress (the centerline trend-midlines' angle, direction seeming to matter the midlines as a series, even with an intervening new 89sma trend midline) until it hits a significant turn.
-----
related ideas:
bar channels (programming, trading discussion)
tick-beat indicator (programming)
various patterns and groups of patterns ('Eur/Usd patterns', rookie discussion).)
-----
Part of the bsTL microverse: Overview, patterns (or, those with fewer or more candles), TF use, trading. (And its future: automatic; precise.)