Yes but I'm having a problem with the "if 47 = 0" part... unless the ??? is just plotted as price.
Ignored
Let's look at it this way.
No particular Pair & no particular price but IF;
47% = 100.00
&
52% = 105.00
THEN
62% = The Price Value of 52% + an Additional 10%.
(the difference between 62% & 52%)
How do I know what value to attribute to 10%?
Simple:
105.00 - 100.00 = 5.00 which is Also = to 5%. {52% - 47%}
If 5% = 5.00 Pips,
Then 1% = 1 Pip.
If 52% = 105.00
Then 62% = 105.00 + 10. or 115.00
I really can understand why this is confusing to most but it does make sense when you get there.
Ignored
Yes I understand the principle behind, the thing is I am trying to get the exact percentage to add/substract to the fib tool so when you plot actual 0 and 100 levels would in fact be 46,56 and 53,44 and give all the rest of levels involved... getting there slowly, anyway
A friend of mine told me he got that line from a guy who trades stocks. I never researched it, just threw it on my fib tool and whaddaya know? Price bounces there quite often.
Well, I understand that the 47 - 53 fib may be a consideration zone but you can beat me and I can't get how you trigger the fibs, where is 0.00 and 100% on your chart?
Ignored
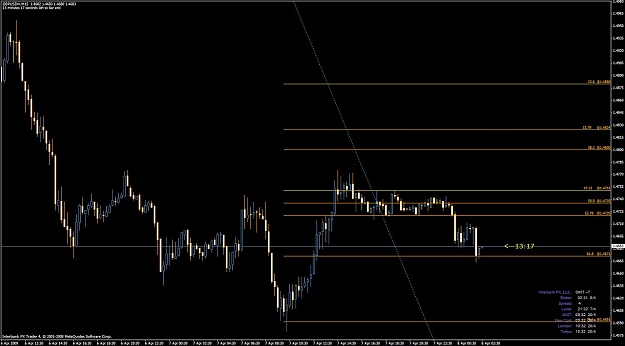
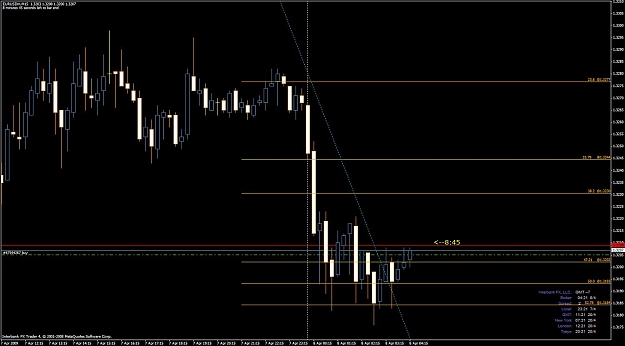
Don't have enough historical Price data on this platform to be specific. Best I can do is show an image.
BTW, not only did my chart match yours to the pip, but my values were calculated with a different core range (47-53).
Ignored
The decimal places have little effect on Charting.
That's why I wasn't too concerned about whether it was calculated @ 47.21 or 47.22.
The Actuals are 47.2136 & 52.7864
I'm not using the indicator yet. I need to study it more. But I manually fibbed out a channel on the eurusd and I have a buy order in @ 1.3205- targeting 1.3230 (or the 38.2 Fib) for my TP.
It should be known I plotted the channel with a line chart.
The decimal places have little effect on Charting.
That's why I wasn't too concerned about whether it was calculated @ 47.21 or 47.22.
The Actuals are 47.2136 & 52.7864
Ignored
The "core range" values I spoke of are price ranges. Cobra interpreted a different high and low price for the (roughly) 47-53 range, yet we ended up with the same fib extension values.
I'm not using the indicator yet. I need to study it more. But I manually fibbed out a channel on the eurusd and I have a buy order in @ 1.3205- targeting 1.3230 (or the 38.2 Fib) for my TP.
It should be known I plotted the channel with a line chart.