|
Commercial Member
|
Joined Jan 2009
|1,815 Posts
The SMART Trader VSA (Volume Spread Analysis) Software Update (1.0.4) Is Now Live you should have a notice on your charts as well.
The update includes the following changes/additions:
Added a new template (Smart Default) based on our "Clean" template which you see in many of our screenshots
Updated all templates to account for the changes and additional signal modules.
Added The Pinko Commie Advanced Signal Module (Proprietary Signal - Weakness)
Added Smart Reverse Shakeout Module (Proprietary Signal - Weakness)
Added High Volume Effort To Rise Signal Module (Weakness Signal)
Added High Volume Effort To Fall Signal Module (Weakness Signal)
Optimized Background scanner(s) to account for new modules and signals
Optimized Effort To Rise Module (To account for the addition of the new High Volume ETR module)
Optimized Effort To Fall Module (To account for the addition of the new High Volume ETF module)
Optimized the No Demand Module
Optimized the Supply Test Module
Optimized the Shakeout Module
Added Caution Signal (Color and Alert Sound) for potential (Unconfirmed) No Demand
Added Caution Signal (Color and Alert Sound) for potential (Unconfirmed) Supply Test Module
Added No Selling Pressure Module
Added Caution Signal (Color and Alert Sound) for potential (Unconfirmed) No Selling Pressure Module
Optimized VWAP Price Module
Added a custom interval setting to the VS/R Module (default was daily before)
Added a setting (VolumeLookback) for the climax bars. Volume must be the highest volume in VolumeLookback periods to classified a climax bar.
Added "Climactic Action" signal bars. Any bar that is ultra high vol and ultra spread is now painted it's own color
The HVA/Z Module (High Volume Area Module) is not included in this update as it is still going through testing.
The Smart Buying Signal Module is not included in this update as it is still going through testing.
The Smart Selling Signal Module is not included in this update as it is still going through testing.
The Smart Volume Module is not included in this update as it is still going through testing .
Added the following Audio Alert Sound Files:
smart_reverse_shakeout.wav
smart_pinko_commie.wav
smart_unconfirmed_supply_test.wav
smart_unconfirmed_no_demand.wav
smart_no_selling_pressure.wav
smart_unconfirmed_no_selling_pressure.wav
smart_hv_effort_to_rise.wav
smart_hv_effort_to_fall.wav
Each of the new signals and changes are accompanied by a corresponding color and alert addition. To familiarize yourself with the new signals and changes we recommend using the "default" template initially. All of our templates have changed so please save any custom templates from an existing installation prior to installing this update.
You can download the update from within the clients area. Please be sure to download both the installer and the sound installer as we have added new audio alerts.
If you have any questions regarding SMART Volume Spead Analysis Software or this update please feel free to submit a ticket at our website http://www.smartvsa.com or join us in our Live VSA trading Room at http://vsa.pipbuilders.com during normal market hours.
Hey there, I find this indi very useful. Unfortnately it can be easy to miss divergence signals. Would anyone with some coding skills mind adding a simple alarm so when the indicator signals a divergence, an alarm or buzzing sound goes off? It would need to work on both time-based charts and also offline range bar-based charts.
Thanks very much and I hope others benefit from the indi too.
Is it this possible that someone to explain what are the advantages of this software over Metatrader?
I know that the dots that appear over the tops and the bottoms are repainting. They recalculate all the time. Another way to say that they are the same as the zig - zag or super signal indicator for MT4.
I mean I am interested in the added value features.
Ignored
The only way to "know they change" is if you actually use the software which means you would "know they DON'T change" so...
The dots do not repaint. It's not possible. If you mean the sow signals (squares) then yes they can because they use some averaging (we are working on a visual BG scanner to replace it) and if you reload a time frame or chart, the range that it uses to average changes so it sometimes will change the position of these signals. This doesn't matter in real time as these are merely indications not tradeable signals but if you see one appear real time you can be confident in them.
That said Bars and icons for the VSA and Smart VSA patterns will never change... it's not possible as they use volume spread and price close to determine if a signal is valid or not.
I hope this clears this up.
You can see multiple examples and the value by visiting any of the links listed within this thread. IE posterous, the chat room or facebook and G+ pages.
On an unrelated note Smart Buying and Smart Selling Modules are being tested now and the Smart Volume and HVZ modules are likely going to be included in the next update.
If you have any additional questions pop them in a support ticket or in the chat.
Thanks for the information. By the way which MT4 broker has the closest data feed similarity to esignal for tick volume. I heard Forex.com is providing esignal data feed for account size of USD1000. Thank you.
Could any of the veterans, help me with this M15 chart of E/U?
I see buying on the left of the chart, as price was dropping.
But then at the first arrow, all of a sudden there is a burst in volume on a seemingly 'insignificant' up bar.....the volume seems out of place, is this selling/supply? ...... then 2 HV upthrusts, is this more supply coming in?
I'm particular curious about the first burst in volume..........
Thanks in advance for any help.
Ignored
Doesn't SMART have a manual? I expect whilst smart will help interpret vsa trades it still helps to fully understand the logic of vsa so you are not fully relying on the signals alone that SMART is spitting out.
Doesn't SMART have a manual? I expect whilst smart will help interpret vsa trades it still helps to fully understand the logic of vsa so you are not fully relying on the signals alone that SMART is spitting out.
Ignored
Thanks, no real manual, but heard something is in the works....not sure how detailed it will be........
I'm able to determine obvious VSA 'signals', but not able to tell a bar by bar story like Malcolm and Hidden Gap and others do.
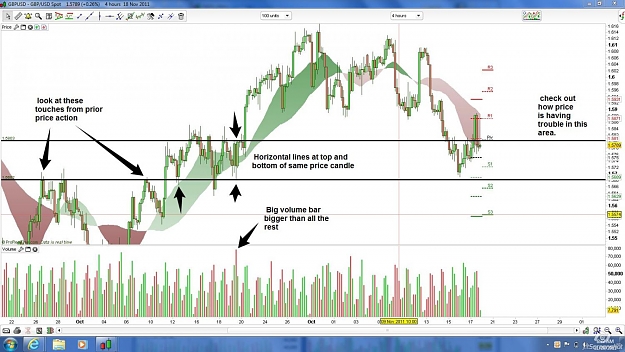
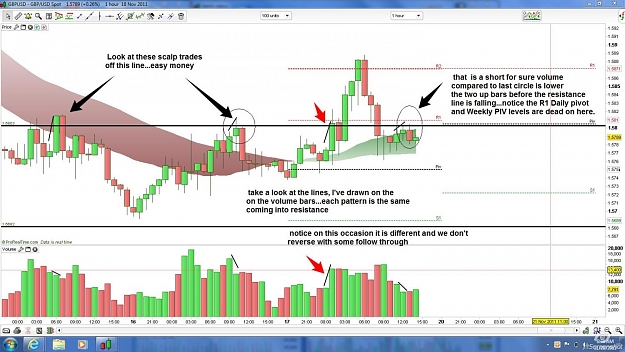
Just wanted to see how this works...new to VSA and Forex Factory, but I"m very excited about it...have some charts so any comments would be great, thanks.
If you want to play safe reduce your leverage and trail with a sell stop on the up bars with decreasing volume...
Ignored
thanks,if i ve understand well so far,smart money is trying to get byers in to sell to them in high prices,so what is happening now is that they are testing for demand and it appears there is no demand there due to low volume.but the herd has already get in buying the pair...