Pivot trading
I’ve gotten a number of PM’s and emails over time asking me about both the “M” pivots and especially what I call Quarter Pivots or QP’s on my charts. The traditional Support and Resistance pivots are fairly well known and there is plenty of information already out there on them already along with various ways to trade them so I won’t try to improve on that.
Indicators
Before I go any further, Let me give my 3 sentence view on indicators in general, and this applies to pivots as well.
1. Any data of any kind on any chart is basically only a graphic representation of price, time, and in some cases volume, that has been subjected to various calculations.
2. The result of those calculations turns into a “something” that may represent what was, what is, and in some cases may alert us to the potential of something that “might be.”
3. Our experience, mood, understanding of the markets, awareness of the long and short term trends in play at the time, and our immediate trade situation among other things will develop a bias in us as to how that “something” may affect future price where that future may be measured in seconds, minutes, hours or days.
Actually, that “bias” is the first thing we need to be careful of, but that’s a separate topic. So, we have to decide what we think about all that, and most importantly, what are we going to do about it.
That said, Pivots can help give us a “grid” where we can have a thought out and proactive plan in place at different price levels to implement without having to “react” in a knee jerk fashion to quickly changing market directions. That “reaction trading” leads to “chasing the trade” or “catching a falling knife” and rarely works out well.
What are Pivots?
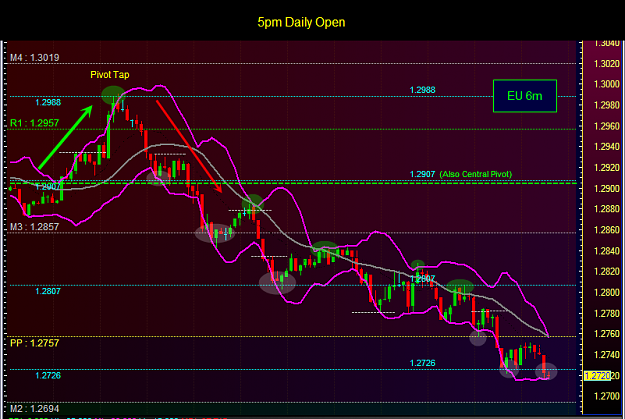
Daily pivots are simply price levels calculated from the previous days HLC or High/Low/Close data where we can anticipate that price will respect them as Support or Resistance (S/R) levels, with an appropriate action to follow.
The same is true for the M1 thru M4 or Mid Pivots as well, but I will say that since many pivot tools don’t calculate them, apparently they aren’t as well known with many newer traders. Simply put they are the middle price levels between any of the Support or Resistance pivots and include the Daily Pivot as well.
While all that is fairly simple, where it gets a little complex is determining the time used for the Basis of calculating the HLC data to get the pivots. Different HLC data depending on both the difference between various broker data and the time each broker uses for the Close of the Daily session will give different pivot values.
I use a 5pm EST ((or 2100GMT)) for calculating Daily pivots using the HLC data from FX Solutions Accucharts. Over time, I have found them to be very accurate for my purposes. Before that, I used the Pivots from Actionforex and found them fairly accurate as well, manually inserting them into my charts every day which got very tedious. They can be found at http://www.actionforex.com/ Technical>Pivot Points on the Toolbar.
Why Does It Matter?
The Basis time for calculating the pivots matters for this reason. Let’s say there’s a large move an hour after I’ve calculated my pivots and someone else’s daily session closes 3 hours later at 0:00 hrs GMT. That big move will change the HLC data enough that their pivots could be significantly different than mine. Flat PA during that same time period will generate far smaller differences that may not be a real factor but 30-60 pips difference or more would probably skew things enough to matter.
This is an ongoing topic of discussion among traders that use pivots. For me it’s real simple, I just trade my own pivots...
5pm EST is a widely used time but it's not used exclusively for several reasons I won’t get into here., Some great traders that I have discussed this with before like Doblece and Cobra use different pivot methods with good results. I know if their pivots are different from mine, they HAVE to be great traders to make any pips… Oooops, sorry. This was supposed to be serious.
Hopefully they’ll chime in sometime on this topic as well and share how they arrive at their pivots and how they trade them, or give their 2 pips on any questions. Acumen and Eyevoltage are a couple of premier pivot traders as well that I know of, so between all of us and a couple others I haven’t mentioned, I’d think we might be able to either find an answer for your questions or confuse you beyond all hope. Ooops again.
The best thing I can say is to load up some pivots and get a feel for them. I believe you’ll get it sorted soon enough as you begin to identify those patterns of price behavior a’rd them.
Want More?
Another learning resource that many newer traders have found helpful regarding Pivots and how to trade them is a site hosted by a trader here at FF with the username of acumen (http://www.forexfactory.com/member.php?u=35073) . His information site which contains instructional videos and other resources can be found at http://www.thefxpivotpoint.com/ or by clicking on his username.
In the following posts, I’ll include some charts and go into a little more detail on some setups to look for.
I’ve gotten a number of PM’s and emails over time asking me about both the “M” pivots and especially what I call Quarter Pivots or QP’s on my charts. The traditional Support and Resistance pivots are fairly well known and there is plenty of information already out there on them already along with various ways to trade them so I won’t try to improve on that.
Indicators
Before I go any further, Let me give my 3 sentence view on indicators in general, and this applies to pivots as well.
1. Any data of any kind on any chart is basically only a graphic representation of price, time, and in some cases volume, that has been subjected to various calculations.
2. The result of those calculations turns into a “something” that may represent what was, what is, and in some cases may alert us to the potential of something that “might be.”
3. Our experience, mood, understanding of the markets, awareness of the long and short term trends in play at the time, and our immediate trade situation among other things will develop a bias in us as to how that “something” may affect future price where that future may be measured in seconds, minutes, hours or days.
Actually, that “bias” is the first thing we need to be careful of, but that’s a separate topic. So, we have to decide what we think about all that, and most importantly, what are we going to do about it.
That said, Pivots can help give us a “grid” where we can have a thought out and proactive plan in place at different price levels to implement without having to “react” in a knee jerk fashion to quickly changing market directions. That “reaction trading” leads to “chasing the trade” or “catching a falling knife” and rarely works out well.
What are Pivots?
Daily pivots are simply price levels calculated from the previous days HLC or High/Low/Close data where we can anticipate that price will respect them as Support or Resistance (S/R) levels, with an appropriate action to follow.
The same is true for the M1 thru M4 or Mid Pivots as well, but I will say that since many pivot tools don’t calculate them, apparently they aren’t as well known with many newer traders. Simply put they are the middle price levels between any of the Support or Resistance pivots and include the Daily Pivot as well.
While all that is fairly simple, where it gets a little complex is determining the time used for the Basis of calculating the HLC data to get the pivots. Different HLC data depending on both the difference between various broker data and the time each broker uses for the Close of the Daily session will give different pivot values.
I use a 5pm EST ((or 2100GMT)) for calculating Daily pivots using the HLC data from FX Solutions Accucharts. Over time, I have found them to be very accurate for my purposes. Before that, I used the Pivots from Actionforex and found them fairly accurate as well, manually inserting them into my charts every day which got very tedious. They can be found at http://www.actionforex.com/ Technical>Pivot Points on the Toolbar.
Why Does It Matter?
The Basis time for calculating the pivots matters for this reason. Let’s say there’s a large move an hour after I’ve calculated my pivots and someone else’s daily session closes 3 hours later at 0:00 hrs GMT. That big move will change the HLC data enough that their pivots could be significantly different than mine. Flat PA during that same time period will generate far smaller differences that may not be a real factor but 30-60 pips difference or more would probably skew things enough to matter.
This is an ongoing topic of discussion among traders that use pivots. For me it’s real simple, I just trade my own pivots...
5pm EST is a widely used time but it's not used exclusively for several reasons I won’t get into here., Some great traders that I have discussed this with before like Doblece and Cobra use different pivot methods with good results. I know if their pivots are different from mine, they HAVE to be great traders to make any pips… Oooops, sorry. This was supposed to be serious.
Hopefully they’ll chime in sometime on this topic as well and share how they arrive at their pivots and how they trade them, or give their 2 pips on any questions. Acumen and Eyevoltage are a couple of premier pivot traders as well that I know of, so between all of us and a couple others I haven’t mentioned, I’d think we might be able to either find an answer for your questions or confuse you beyond all hope. Ooops again.
The best thing I can say is to load up some pivots and get a feel for them. I believe you’ll get it sorted soon enough as you begin to identify those patterns of price behavior a’rd them.
Want More?
Another learning resource that many newer traders have found helpful regarding Pivots and how to trade them is a site hosted by a trader here at FF with the username of acumen (http://www.forexfactory.com/member.php?u=35073) . His information site which contains instructional videos and other resources can be found at http://www.thefxpivotpoint.com/ or by clicking on his username.
In the following posts, I’ll include some charts and go into a little more detail on some setups to look for.
FUBAR...