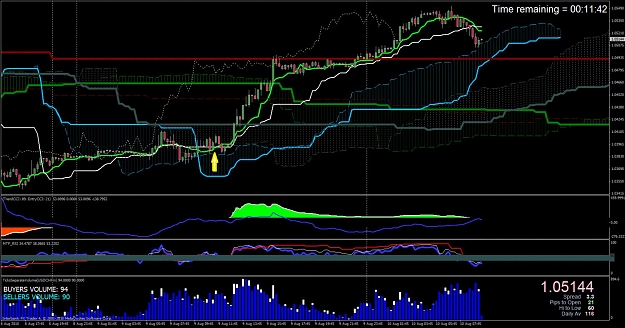
This chart looks congested at first but watch how there is a high probability cross of the green TENKAN SEN above the white KIJUN SEN at the yellow arrow. It than rises through the gray 30 minute time zone spans A and B but takes its time. It hesitates at the red Senkou Span A (dashes) of the 240 minute. It crosses after some hour hesitation at the 60 minute green thick Senkou Span A. It than jumps to the red thick Senkou Span A of the 240 minute time zone. After several hours it breaks through until price finally exhaust itself. It than is falling back to the base 15 minute time zone of the chart where it starting to catch support from the aqua A Senkou Span.
At the same time you will see on the chart each time zone Ichimoku do the a Senkou Span Twist with resistance becoming support. Looking at a chart with the Kino Ichimoku tool is fascinating. Seeing support like this can help you stick with a trade longer than you might if you were looking a chart with out the Kino Ichimoku tool. .
At the same time you will see on the chart each time zone Ichimoku do the a Senkou Span Twist with resistance becoming support. Looking at a chart with the Kino Ichimoku tool is fascinating. Seeing support like this can help you stick with a trade longer than you might if you were looking a chart with out the Kino Ichimoku tool. .
Attached Image (click to enlarge)