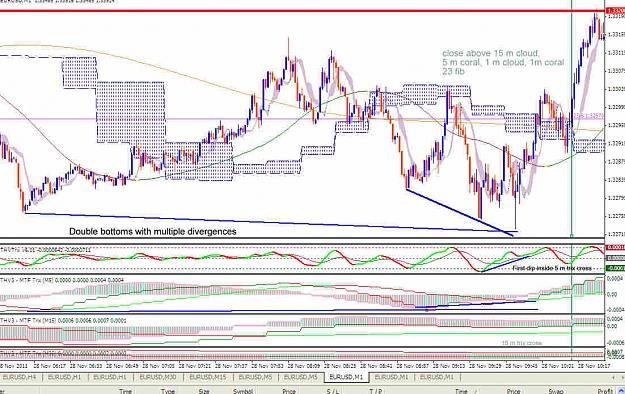
DislikedSomething like the chart below ... Imagine the blue line is the EU 15m chart and the green one the 5m one ; One price line superimposed to the other one , that,s what I mean ...
Thanks
http://flowindi.com/images/example/RCS2.pngIgnored
you can modify this indicator to get what you require
I don't have time today to do that
I hope that helps
Attached File(s)