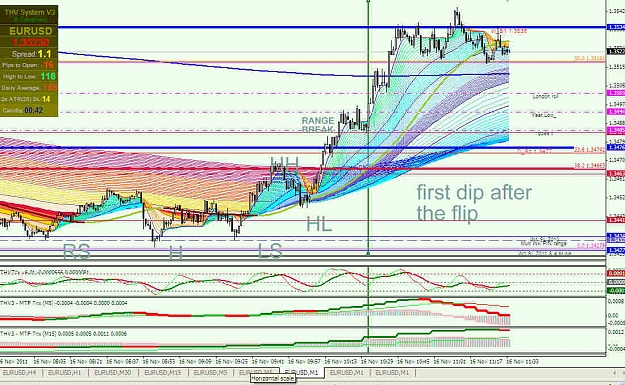
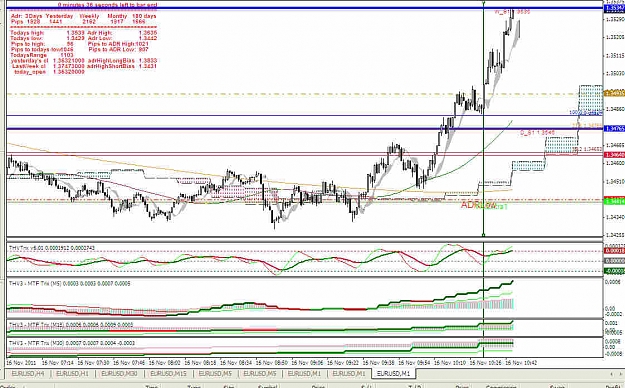
What I'm looking for is that wishbone kind of shape in the trix before the trade in the opposite direction (showing there is enough volatility and the dip is good enough), then for the fast trix to come below zero, then for price to stall out and consolidate, then for the slow trix to flatten out and the fast one to turn up and approach it, giving an indication which way the price consolidation is going to break out, this to happen around or near to the zero line (not in o/b for a long or o/s for a short). And I'm looking for it in the direction of the higher tf trixes after a recognizable pattern -triple bottom and range breakout on the 5m chart in this case
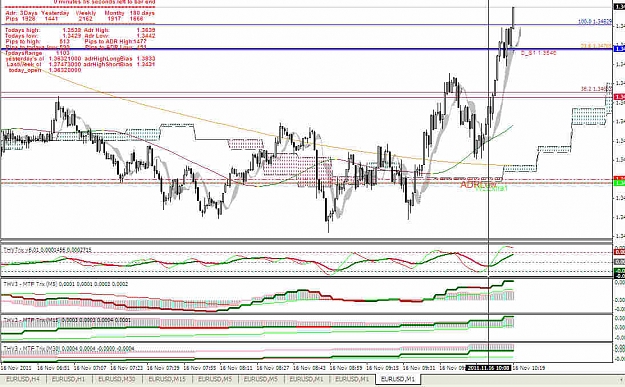
Before

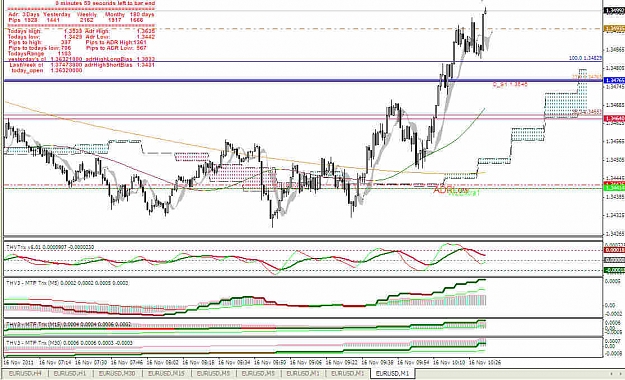
After
Before
After
Before
Attached Image (click to enlarge)
After
Attached Image (click to enlarge)
Before
Attached Image (click to enlarge)
After
Attached Image (click to enlarge)
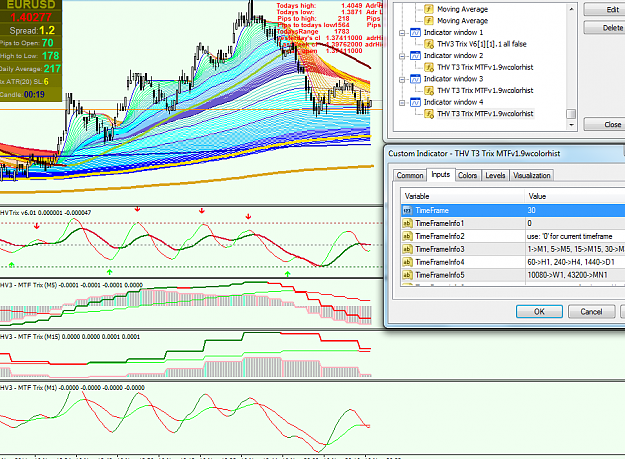
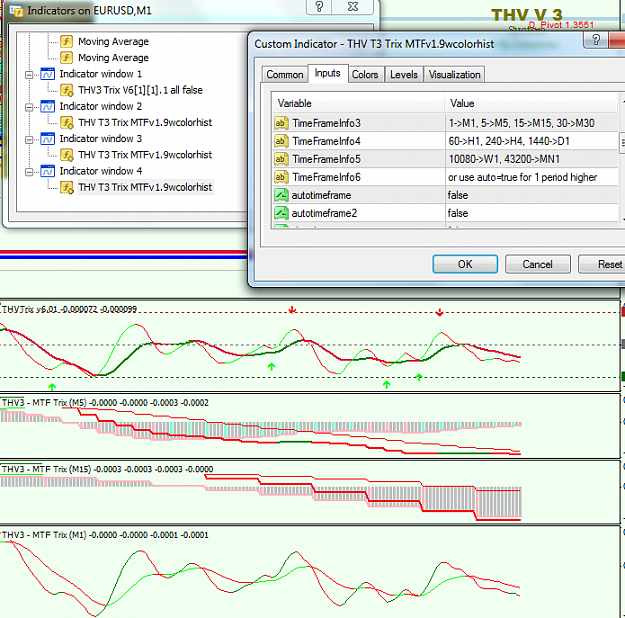
Disliked"quote" Re the 1m trix, the right look (usually) is when the fast has gone below zero (for a long) or above zero (for as short), and the slow trix is near zero and flattening out, and you can see the distance between then is narrowing
You mentioned this before, but im having a problem understanding, would you be able to show this when you get a chance.Ignored