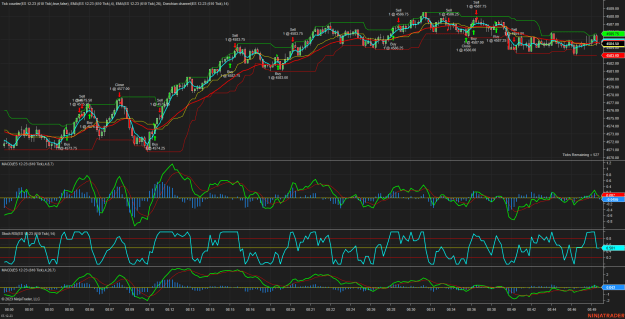
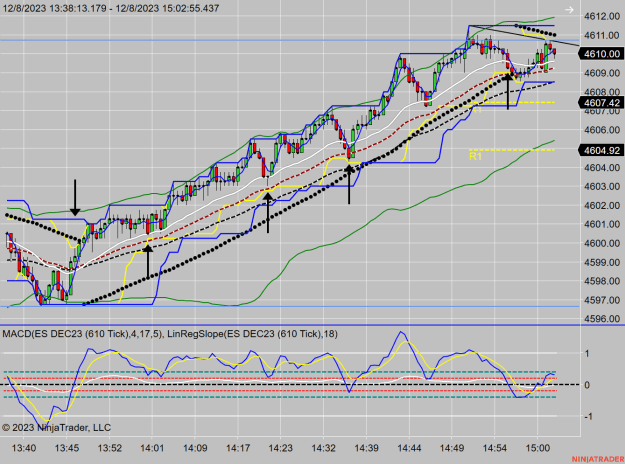
Dislikedyou know it is just flat when the 610 tick chart is showing .50 half point increments. Playing with Eurorally's idea and I am about 50/50 on the wins and losses. but it is slow today. Might just take the rest of the year off. P/A just sucks since the 15th of Nov.{image}Ignored
I am pleased to have met you here. Looking at your charts you have confirmed what I have been doing as correct. This is somewhat unusual because there is a lot of nonsense floating around pretending it is genuine. I also have some books on trading that contain the same nonsense. Just take a look at the business section of Barnes & Noble. You will see numerous books stating the obvious - namely, what I call descriptive models of the market that do not tell you in the least how to TRADE the market for profit.
So the advice given freely on various websites, on You Tube and even in the trading courses is sort of "for the birds:"
"Stop has to be big:" How big? How is it based on a statistical evaluation of my market? How are different levels of Stop for the same market going to effect my profit?
"No fixed target:" Oh really? Is this based on the statistical analysis of your market?
"Stay away from a horizontal market:" How is it defined? What is the measure of horizontal market? Stay away because of eigentlich what - because we do not know how to trade it?
Etc. etc.
Here are my further comments, which are purely my opinion but are based on years of experience:
1. I would be opposed to trading from charts with several timeframes on them even though it is widely talked about. I just do not see any advantage.
2. I would be opposed to trading from several indicators at the same time because I know I cannot judge and evaluate several indicators at the same time.
3. Horizontal markets - a bane of most traders. Notice that on my charts I trade the horizontal market quite successfully.
- I said that before above even before I embarked on the latest version of the trading method constituted by my last charts above.
- Until very recently, my charts were nearly identical with yours and the signal was when the MACD crossed the zero line. It works quite well.
- The important concept here is to realize that the price moves from the lower bound to the upper bound and back in the horizontal market !
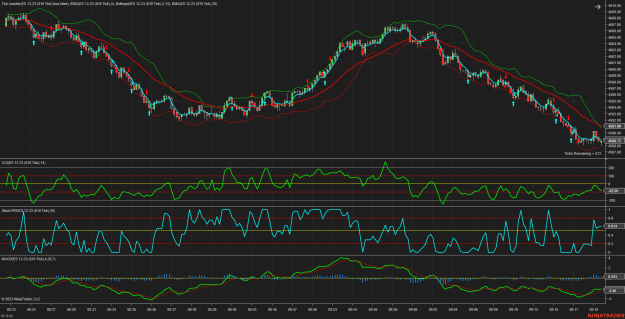
- What are supposed to be the bounds I am talking about? For a long time, I used only the Bollinger Bands.(I remember John Bollinger, a technician on several financial TV stations in the 1990s.)
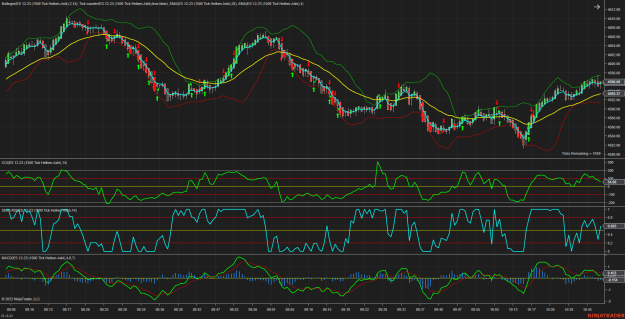
- But the Donchian channel has the advantage of having those horizontal lines signifying a horizontal market whereas Bollinger Bands are more rugged and they do not immediately show the horizontal market.
- You need to do two things: (1) Fit the Bollinger bands and Donchian Channel to your market so it would give you the maximum opportunities to trade without many false calls. (2) Superimpose the Donchian Channel over the Bollinger Band typically based on the same number of bars - you will find they are nearly identical but the Donchian Channel is far more telling. After that, you can drop the Bollinger band entirely.
- Then you can trade with confidence from one bound to another and back in the horizontal marked as I am showing in my charts even before this latest method.
There is a video on FF entitled Tech 101 - How to Trade with Bollinger Bands. It is given by a "technical experts" of a broker. It is one of those nonsensical "descriptive models" and I slammed it for that reason. The lady simply says that the Bollinger Band has a center line with a certain number of standard deviations band on each side and that the width of the band shows the volatility of the market. Nothing else. No description how to fit BB to your market. How to determine the number of standard deviations (does not have to be 2), and what to do with the Bollinger Bands in trading. People who knew noting about BB went gaga about this presentation.
I said that the easiest way to use BB was to trade from one bound to the other in a horizontal market - you can see that in my charts above. (It was poopooed by an "expert" reader.)
4. The Trading method: Until recently with the exception of my last four charts it was identical with your method to a very large extend. The difference was that I used the 610 tick chart only and MACD as an indicator for generating trading signals though I kept several other indicators identical with yours at the bottom of the chart.
The latest trading method I tested only in Replay and then in Sim this morning: I realized two things:
a. The price moves from one bound to the opposite bound
b. This is really only an extension of the idea MACD crossing zero line as this latest methods is liable to capture the full movement of the price from one bound to another (and possibly back).
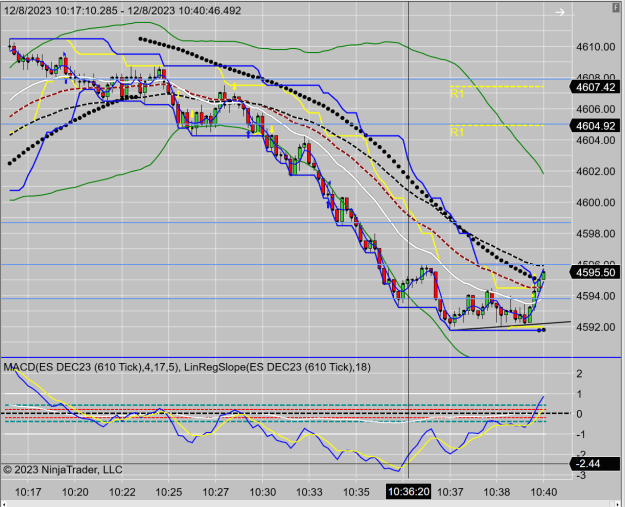
As stated above, the best tool for this is Donchian Channel though the concept comes from the Bollinger Bands. The advantage of the Donchian Channel is in that it has horizontal lines when the market is horizontal.
Thus, it is possible to place a standing order one or two ticks before the Donchian line and wait for the price to come to it and initiate a trade with the target placed one or two ticks before the opposite Donchian line. This because we "know" that the price will go from one bound to another with a high probability.
Naturally, at one point the price will go through the Donchian line. By that time, you may already have several points in profit. But even if this happens, not all has to be lost - the price may turn around and go to the opposite bound as expected. Please see my charts above.
5. All this depends on the trend, either existing trend or the trend being created just now.
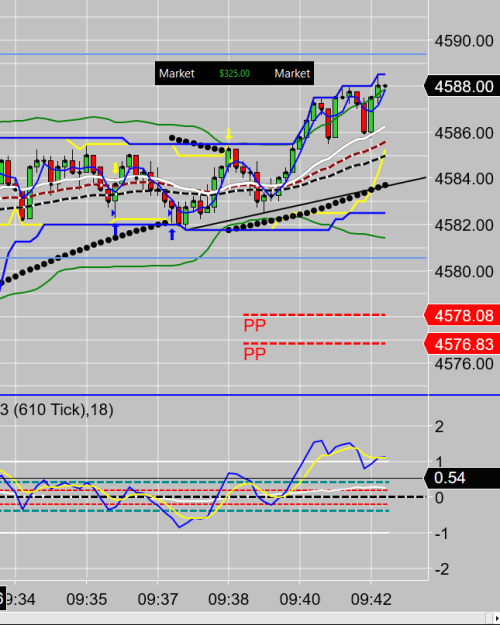
How do I determine the trend? Apart from the highs and lows and the Donchian Channel, I use Parabolic SAR (Stop And Reverse) Indicator - the black dots on my charts (previously magenta lines, which were the same thing).
In a confirmed trend the standing order should be placed on the side of the Donkian signified by the black dots. It is not recommended to trade against the trend in a strong trend as this results in a minimum profit or in a large loss.
The more difficult areas are the change of momentum (Up and Down or Down and Up) plus the areas around the yellow and red horizontal lines called pivot points (this is a standard indicator available on Ninja Trader and elsewhere).
The Donchian Channel is also useful when a trend starts in that the Donchian line bends up in an uptrend and down in a downtrend. This is useful particularly when the price exceeds the previous significant high or low.
In my charts above, you will see that many times I showed insufficient intestinal fortitude in that I did not hold onto a trade until the opposite Donchian line was reached, which would have resulted in more profit. Those instances where I did not originate a trade in the vicinity of a Donchian line were the ones where I either did not get the fill or I was late. All this needs to be repeatedly practised.
IO