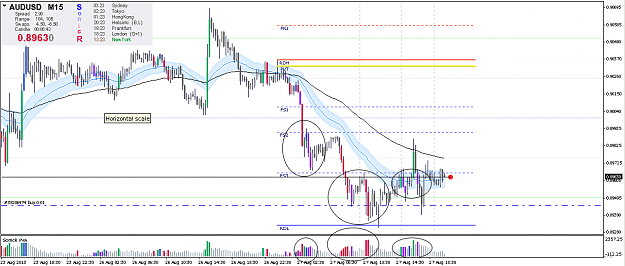
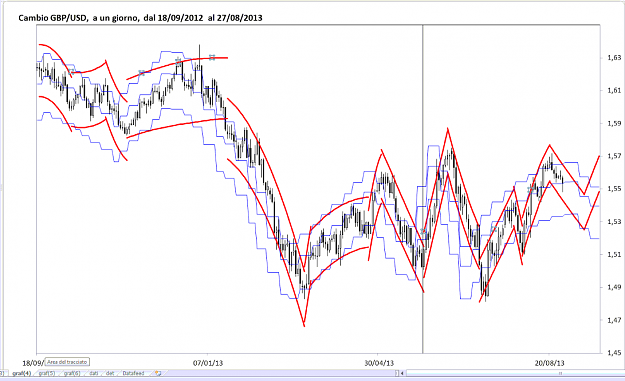
DislikedTo understand, my mind is full now. The enclosed chart how to consider the MMs? confusion, sorry Thank you for your time dedicated. Antonio {image}Ignored
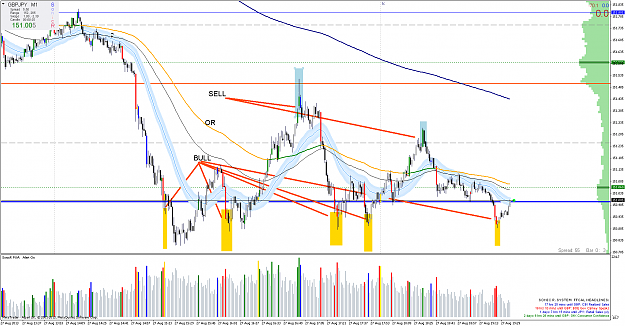
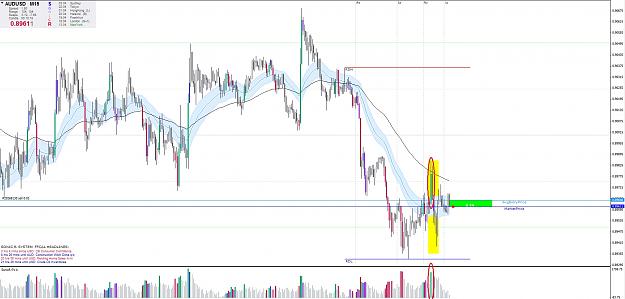
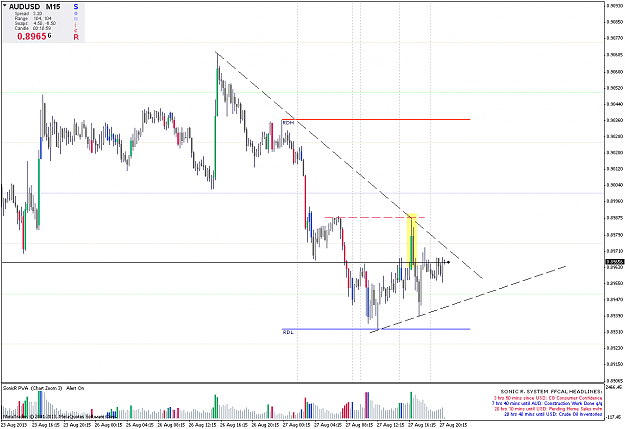
1. Take the green crap on the right side of your chart and toss it! Not necessary and a distraction!
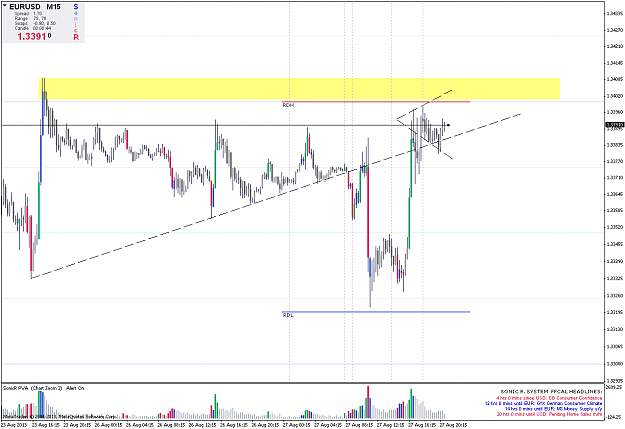
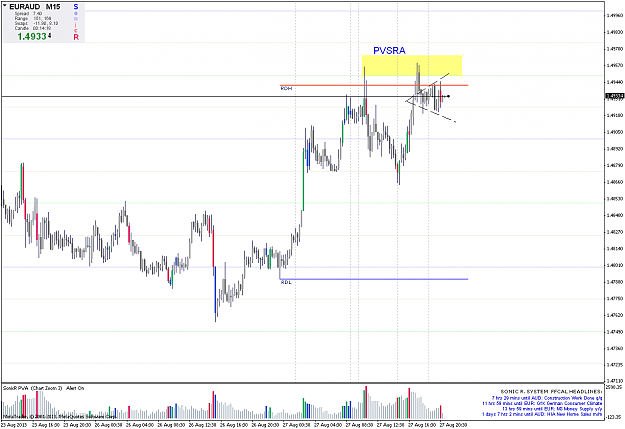
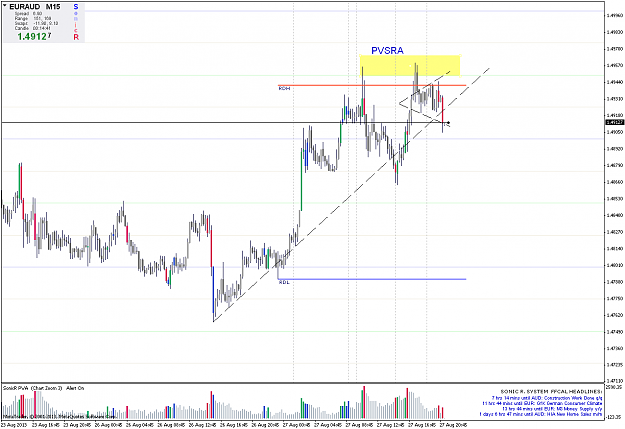
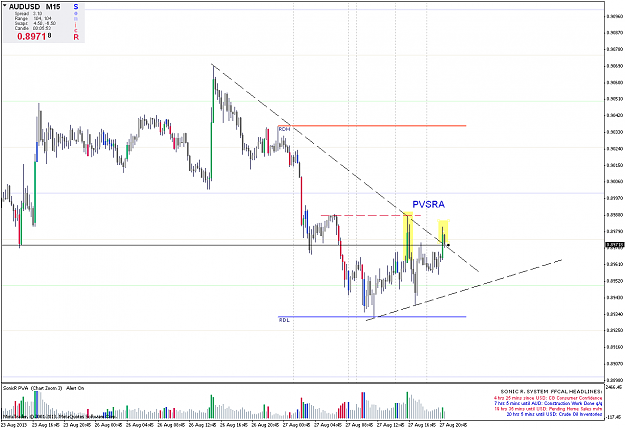
2. The yellow areas mark the price region that the MMs consider too low to allow the price to go below while they are building shorts. Hence, they periodically push the price back up from this area to higher prices more profitable for their shorting activity.
Attached Image (click to enlarge)