{quote} Thanks for clarifying. I like what I'm seeing but if I'm totally honest, I still don't quite understand some of the comments in the original posts. Perhaps I could ask more questions about what I'm finding confusing?
Ignored
Sure,you're welcome to ask......I'll try my best to find straight forward answers,this is why I created the thread,help others and learn too.
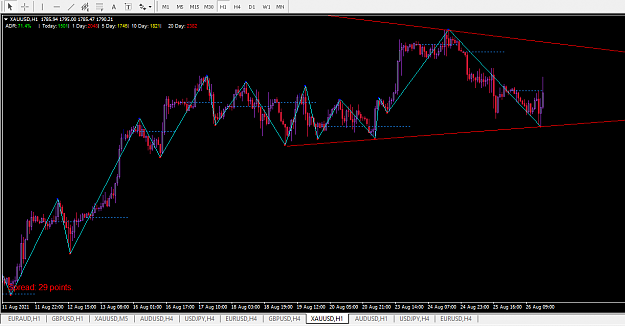
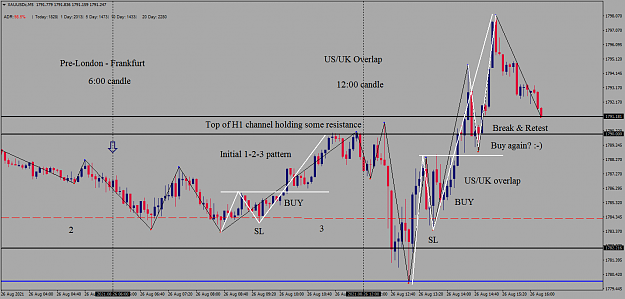
I have my gold chart. Top TL is from the H4 and the bottom TL is joining the swing bottoms on the H1. We can see price doesnt like that TL where it is now and keeps rejecting it trying to go up but also a bit stuck there too. I am still puzzling over the LTF charts and how to implement some trades there. But keep posting bossman, we will get there.
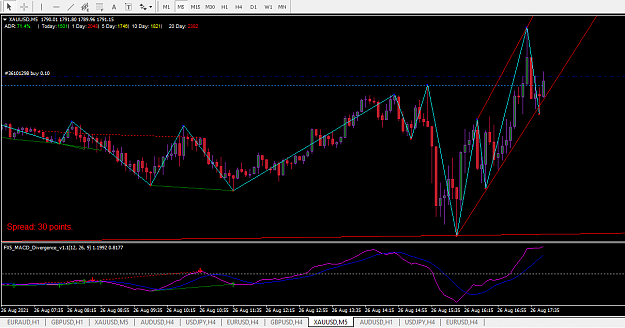
And on the M5 we have what looks like an upward channel making HH and HL heading towards the daily open after the H1 TL rejection. Have opened a long, so lets see what happens
I have my gold chart. Top TL is from the H4 and the bottom TL is joining the swing bottoms on the H1. We can see price doesnt like that TL where it is now and keeps rejecting it trying to go up but also a bit stuck there too. I am still puzzling over the LTF charts and how to implement some trades there. But keep posting bossman, we will get there. {image}
Ignored
Nice charts,each time there is a rejection the price is telling us something...are we in for a HL or LH,as with your chart Alan,simply isolate a swing point,add a vertical line where price rejects the TL and the indicator swing point,its H1 TF and wait until the candle close on making a decision,when this happens drop to LTF maybe 30,15,5,1M TF...look for the 1-2-3 rejection at the swing points,maybe its already happening and that is what we see on H1.The idea is to zoom in and get detail entry rather than waiting for hrs.I'll post XAUUSD chat room with some explanations.....time to eat lol
123 BOOM +52. Got scared and closed it before it noticed me and reversed. Little doji there too
EDIT:- Looks to be resistance at 1797 from the H1 chart.
|
Joined Aug 2021
|
Status: Junior Member
|5 Posts
Good morning Gentlemen.
I'm new to answering on treads, I read this and liked what I seen and put it to test about an hour ago and have put some pips in the bank already. Thank you a lot gentlemen.
I am going to study this tread and will more than likely be asking some questions in the near future.
Good morning Gentlemen. I'm new to answering on treads, I read this and liked what I seen and put it to test about an hour ago and have put some pips in the bank already. Thank you a lot gentlemen. I am going to study this tread and will more than likely be asking some questions in the near future. Cheers Rik
Ignored
Welcome aboard Rixmix,you're more than welcome.....I'll be here to reply,appreciate your interest very much.
|
Joined Aug 2021
|
Status: Junior Member
|5 Posts
Thanks SCSSTNT, I like your tread as you have just talked about learning and the importance of certain aspects. No beating around the bush or over opinionated replies.
This looks like it is going to match in with the other learns I am working with at present. I am happy I woke up in the dark hours this morning to find this tread, great start to my Friday. Have not finished reading all posts yet, however just wanted to check the times you have mentioned being 9pm Tokyo open, 2am London open and 8am being the NY open, would that be a correct judgement?
Also would you mind if I took some screen shots of your screen shots with your explanations on them please?
Thanks SCSSTNT, I like your tread as you have just talked about learning and the importance of certain aspects. No beating around the bush or over opinionated replies. This looks like it is going to match in with the other learns I am working with at present. I am happy I woke up in the dark hours this morning to find this tread, great start to my Friday. Have not finished reading all posts yet, however just wanted to check the times you have mentioned being 9pm Tokyo open, 2am London open and 8am being the NY open, would that be a correct judgement?...
Ignored
Anytime RM.......I am -4:00 GMT time zone 9pm (2hrs after Tokyo opens) , around 2:00-4:30 am then we have 8am NY open til about 11am for trading Gold getting most volatility.
|
Joined Aug 2021
|
Status: Junior Member
|5 Posts
Thanks for answering and that link you put up, I must have missed something along the way as I did not know that was available or I'm just a little slower than others
I just used the same theory on oil with good result so far. they are smaller moves that I worked with, and still proved to work.
This is by far my best trading week ever. It is only going to get better from here with your thread.
{quote} Sure,you're welcome to ask......I'll try my best to find straight forward answers,this is why I created the thread,help others and learn too.
Ignored
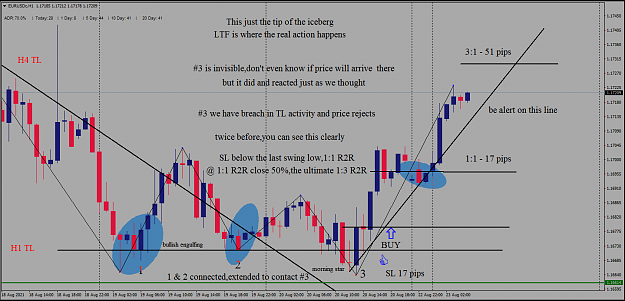
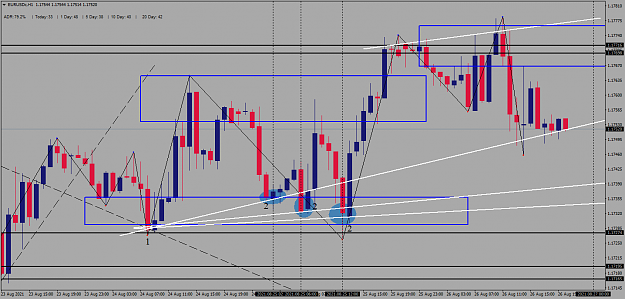
Great stuff, thank you very much. OK, I'll start with a few general questions if that's OK. Please reference one of your early charts below:-
Attached Image (click to enlarge)
1) Where you have specified "H1 TL", you are referring to the ZZ, not the adjacent horizontal line?
2) Looking at point #2, you use that point as the main reference. So, if a horizontal line (HL) drawn at the lowest body at #2 intersects anywhere with price at #1, we have the initial connection and requirement?
3) Is the point of the HL intersection with#3 to show a break of trend in order to trade with the break of trend?
I can't think that #1, #2 and #3 could all connect with the HL and stay on the same side of the higher timeframe trend line.
Thanks for answering and that link you put up, I must have missed something along the way as I did not know that was available or I'm just a little slower than others I just used the same theory on oil with good result so far. they are smaller moves that I worked with, and still proved to work. This is by far my best trading week ever. It is only going to get better from here with your thread.
Ignored
I'll always answer and thanks for asking,its easy to miss information in real time,it happens with me,I lost the opportunity getting in at the best times for trading,I don't worry,you not slow,no way...yes Oil is good for smaller time frames getting i and out quickly.....I'm happy to have you...keep safe with the situation all over bro,same to your family.
{quote} Great stuff, thank you very much. OK, I'll start with a few general questions if that's OK. Please reference one of your early charts below:- {image} 1) Where you have specified "H1 TL", you are referring to the ZZ, not the adjacent horizontal line? 2) Looking at point #2, you use that point as the main reference. So, if a horizontal line (HL) drawn at the lowest body at #2 intersects anywhere with price at #1, we have the initial connection and requirement? 3) Is the point of the HL intersection with#3 to show a break of trend in order...
Ignored
1. The ZZ make automatic swing points according to its inputs,thats the indicator.Manually you construct a TL using those points.
2. Point #2 close price at bearish H1 candle.This position on the TL is valid as a connection on price holding the line even with a wick, as long as the body is supported above the line we look for another extension on price.1 & 2 must make some some level to be extended on point 3 in the future.Sometimes it will move away from point #2 and now make 3,as we expect price holding on a tangent.
3. At each point from 1-3....on LTFs will be able to assist in the rejection of price going lower and that is what we are trying to do establish.At point #3 its seems selling will continue within the 1H candle , but never continued and the same candle was a blue bullish one and price never returned as I type right now....turning points and getting in early analysing HTF down to LTF.
{quote} 1. The ZZ make automatic swing points according to its inputs,thats the indicator.Manually you construct a TL using those points. 2. Point #2 close price at bearish H1 candle.This position on the TL is valid as a connection on price holding the line even with a wick, as long as the body is supported above the line we look for another extension on price.1 & 2 must make some some level to be extended on point 3 in the future.Sometimes it will move away from point #2 and now make 3,as we expect price holding on a tangent. 3. At each point from...
Ignored
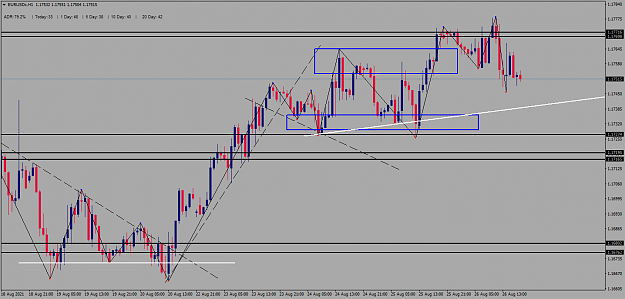
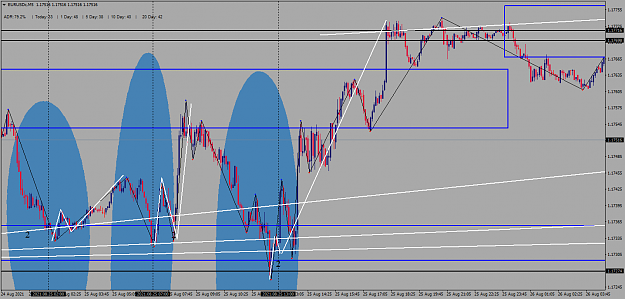
Thanks for your fantastic explanation! It's starting to make much more sense now. Please kindly refer to the image below. Have I understood the correct location(s) of points #1, #2 and #3 ? The reason I ask is the white line intersects three lows but, the ZZ misses one of the lows so, just to be sure, I thought I'd ask
{quote} I'll always answer and thanks for asking,its easy to miss information in real time,it happens with me,I lost the opportunity getting in at the best times for trading,I don't worry,you not slow,no way...yes Oil is good for smaller time frames getting i and out quickly.....I'm happy to have you...keep safe with the situation all over bro,same to your family.
Ignored
Cheers mate and the same to you and your family in this crazy time we live in.
{quote} Thanks for your fantastic explanation! It's starting to make much more sense now. Please kindly refer to the image below. Have I understood the correct location(s) of points #1, #2 and #3 ? The reason I ask is the white line intersects three lows but, the ZZ misses one of the lows so, just to be sure, I thought I'd ask {image} Thank you very much!
Ignored
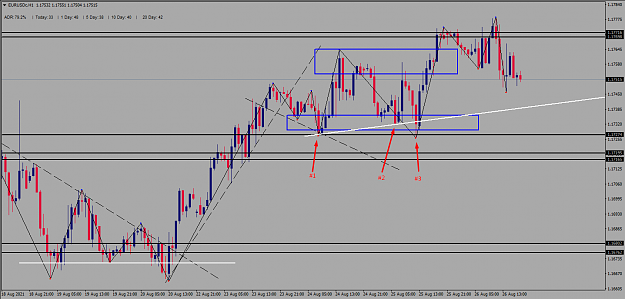
Attached Image (click to enlarge)
Attached Image (click to enlarge)
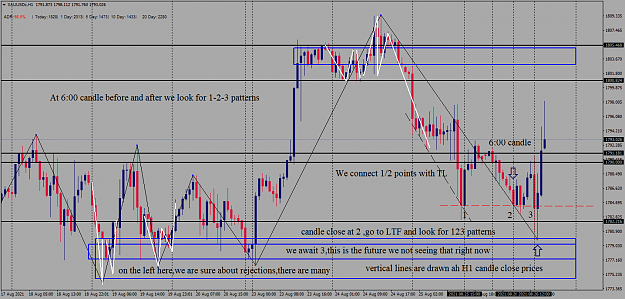
Million Dollar Question
We now have #1 followed by THREE (3) #2s
At a certain point in time we always think that the preset low is the low we expect the market to paint with prices and candlesticks.This does not happens,for many reasons,I highlighted 3 areas,we take the fist low mark the level after candle on H1 closed and place vertical line,on lower TF we do look for 123 patterns to the left and present price action,if none is available,we wait.Price retraced up and came back down giving us the LH/LL combination and at point,now the 2nd low observe and move the TL to that low as previous low not interested because we're learning to BUY as the very lowest prices with hardly any DD.At 2nd highlighted low candle closed go across to LTF and search for 123 formations.......do the same for the 3rd and which can be said is the final low found in that series.
{quote} {image} We now have #1 followed by THREE (3) #2s At a certain point in time we always think that the preset low is the low we expect the market to paint with prices and candlesticks.This does not happens,for many reasons,I highlighted 3 areas,we take the fist low mark the level after candle on H1 closed and place vertical line,on lower TF we do look for 123 patterns to the left and present price action,if none is available,we wait.Price retraced up and came back down giving us the LH/LL combination and at point,now the 2nd low...
Ignored
Looks like the TL are being drawn from candle bodys and not the wicks? That would mean the lower TF candles will break the TL before reversing back thru.
{quote} Looks like the TL are being drawn from candle bodys and not the wicks? That would mean the lower TF candles will break the TL before reversing back thru.
Ignored
These wicks that spike low do close above as in buys,especially as we're attacking the low level TL formations getting breached we have seen, gets panic into traders and they think selling is going to continue and hold all positions,not looking at the directional movement overall.We can work all day and watch HTF but the second you see swings starting to form,connect the points then go to LTF,a trade might be in the making,this is the edge you want
THE ANNUAL MEETING OF THE FEDERAL RESERVE BEGINS IN JACKSON HOLE TODAY
The US stock market closed in the green zone yesterday. The financial, industrial, and oil and gas sectors were the growth leaders. The S&P 500 increased by 0.22%, the Dow Jones added 0.11%, and the Nasdaq added 0.15%. At the same time, the S&P 500 and Nasdaq indices renewed their price records.
The annual meeting of the Federal Reserve will begin in Jackson Hole today. Analysts believe that the Fed may postpone cutting the QE program because of the global rise of Delta cases. Goldman Sachs experts have raised the odds of a stimulus cut announcement in November to 45% from its previous forecast of 25% and lowered the December chance from 55% to 35%. But a lot will depend on whether the cutting happens this year or next. If the program is cut this year, investors can forget about the stock market’s growth until the end of the year. On the other hand, short interest is at its lowest level in 20 years. The same level was before the collapse of tech companies in 2000. So there is still a possibility that the market will go into a deep correction. Everyone is waiting for Jerome Powell’s speech on the results of the symposium on Friday.
The US House of Representatives has approved a $3.5 trillion budget program. Democrats plan to spend trillions of dollars on a number of social programs but are having difficulty getting these proposals through Congress because the party does not have a substantial majority. Republicans strongly oppose the plans, citing the high cost and unsustainable financial situation of the country.
European stock indices were mostly up yesterday. The British FTSE 100 increased by 0.34%, the French CAC 40 added 0.18%, the Spanish IBEX 35 increased by 0.32%, and the Italian FTSE MIB added 0.12%. Meanwhile, the German DAX lost 0.28%. Germany’s Influential business climate index from the IFO institute has been decreasing for the second month in a row. The reasons for the drop are problems with the supply chain of goods to production and fears of new restrictions due to the increase in Delta cases.
Oil prices have added about 10% this week. But now, the situation in the oil market remains uncertain. On the one hand, oil and gasoline inventories are declining (US commercial oil inventories declined by 2.98 million barrels last week; previously published data of the American Petroleum Institute showed a decline of 1.6 million barrels), which increases the supply deficit in the market. On the other hand, demand for fuel is not growing due to the spread of the Delta strain.
Stock indices of Asia-Pacific countries are decreasing on Thursday. Investors are waiting for greater clarity regarding regulatory reforms that China holds in relation to technological companies. In turn, the Bank of Korea raised its key interest rate by 25 basis points to 0.75% per year. South Korea has become the first major country in Asia to begin to gradually abandon the stimulative monetary policy. South Korea's Kospi index decreased by 0.5% at the opening session. Japan's Nikkei 225 index didn’t change. China's Shanghai Composite decreased by 0.5%, and Hong Kong's Hang Seng lost 1.3%.