Hey guys, I'm a trader and also a developer. So I get quite frustrated that in order to share/discuss my trading ideas, I have to send screenshots back and forth endlessly.
Because of that, I’ve built a collaborative chart platform from scratch and would like some of your feedback on them.
(I know it looks like tradingview charts but it’s not lol. Legit built it from scratch.)
So one of the ideas is that we should be able to link what we write with the stuff we have on charts. So I created this “linking” feature where you highlight a text and select an object on the chart. This helps provide context to the discussions we read especially when someone is referencing a certain chart object (like a trend line or an MA).
(this is a gif, click to see it in action)
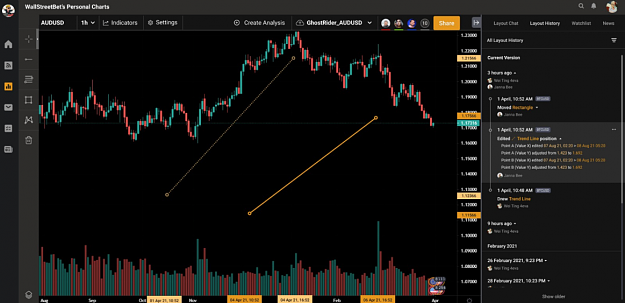
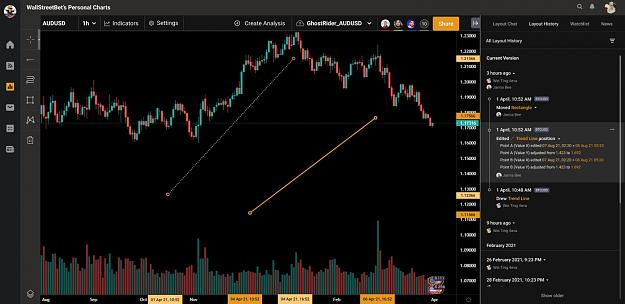
Another idea I have is to introduce real-time collaboration on charts. This would require us to track the edits of each chart just like how google docs does it (or figma for the designers here). Users can view what was changed and also roll-back where needed. Kinda like this (still in the works):
Anyway, this is largely born outta my frustration of the lack of collaborative charting and discussion tools out there. Figured I’d share it with you guys along with the progress. Let me know if you have other suggestions or wanna be super-duper early beta testers haha.
Because of that, I’ve built a collaborative chart platform from scratch and would like some of your feedback on them.
(I know it looks like tradingview charts but it’s not lol. Legit built it from scratch.)
So one of the ideas is that we should be able to link what we write with the stuff we have on charts. So I created this “linking” feature where you highlight a text and select an object on the chart. This helps provide context to the discussions we read especially when someone is referencing a certain chart object (like a trend line or an MA).
(this is a gif, click to see it in action)
Attached Image (click to enlarge)
Another idea I have is to introduce real-time collaboration on charts. This would require us to track the edits of each chart just like how google docs does it (or figma for the designers here). Users can view what was changed and also roll-back where needed. Kinda like this (still in the works):
Attached Image (click to enlarge)
Anyway, this is largely born outta my frustration of the lack of collaborative charting and discussion tools out there. Figured I’d share it with you guys along with the progress. Let me know if you have other suggestions or wanna be super-duper early beta testers haha.
Attached Image (click to enlarge)