{quote} Thank you, Luis. That would be great Once you're on it, if it isn't a problem, could you please make more time frame slots? Say, 5 instead of 3? Have a great weekend too
Ignored
hi
sure .. no problem.
i'll post when i have it .. if not earlier, tomorrow afternoon.
doing this one, i noticed that the previous that i posted has a problem, that i didn't realize at the time .. doesn´t work if one of the timeframes is left as "Current".
this one no longer has that problem.
to make the other change, regarding the time zone, i need a little more time .. need to learn how it can be done.
{quote} hi made the change regarding the number of timeframes slots. {file} doing this one, i noticed that the previous that i posted has a problem, that i didn't realize at the time .. doesn´t work if one of the timeframes is left as "Current". this one no longer has that problem.
Ignored
Thank you very much, Luis. 5 slots is plenty, and I can see you've added a clear description; gives the indi a professional look, which I really like.
Did not test the 'current' setting (for obvious reasons lol), so thanks for squashing the bug.
{quote} to make the other change, regarding the time zone, i need a little more time .. need to learn how it can be done. as soon as i have it, i'll post. luís (:
Ignored
No probs, take your time. I'm sure you'll figure it out sooner or later.
Here's AnyCandle's source file. It does have a TimeShift function, but only for adding to broker's time. We'd need subtracting too, I guess, but hopefully the logic's the same.
yes, with a little more time I made some adjustments.
and with a description it's better, for a person to know what the indicator does .. even for me in the future, in case I forget, I can know by reading the description.
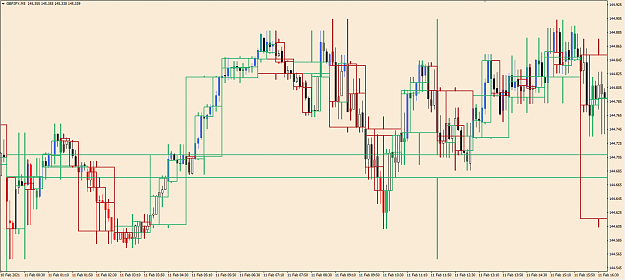
EDIT: this indicator is not working properly, needs to be fixed
Ignored
hi
i tried to make the indicator that finessence wanted, and with the closed market it seemed to work well but, with the open market ... doesn't work so well.
if someone can take a look and fix it, it would be a welcome help
Just my opinion, but if you are using CCI, then your period setting will be very near the same moving average value when it crosses the 0 line. By applying that similar moving average to your chart, as well as the same similar moving average but from different time frames, then when the "price" crosses those moving averages, it is the same as a signal for that time frame's CCI crossing the 0 line. Of course, if you use the CCI indicator across multiple time frames (their period settings adjusted for the viewing time frame), and then add some moving...
Ignored
Thank you for stopping by, dkrock. I have no doubts about your experience and expertise, but I'm not looking for any CCI, MACD or TDI derivatives, nor anything based on moving averages. With all due respect, at the risk of being wrong, I'll stick to my original idea.
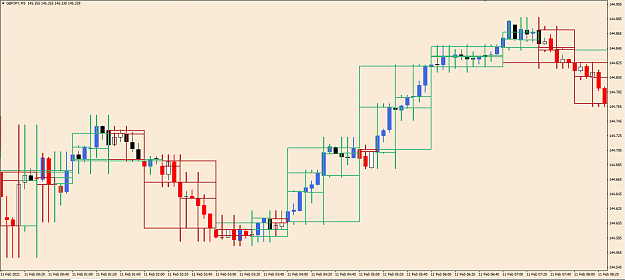
Hi all, Just for illustration of what I'm after, the green and red candles in the pic below are CCI candles. I believe there are other similar indicators, e.g. RSI candles, MACD candles, etc. They highlight candles or a series of candles in the chart, with a user defined colour, according to the underlying indicator's parameters. What I'm looking for is a similar but purely price-based indicator that will highlight those lower time frame candles which are simultaneously going in the same direction as (user defined) multiple higher time frames. Example:...
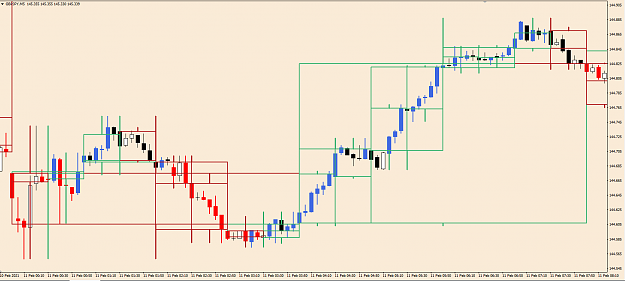
{quote} Luis, sorry, it's not you, it's me. The problem is not your indicator, but the broker/server time. The one I posted earlier was FTMO; they are GMT+1 Now checked on IC Markets and it's perfect! You are offcially a genius {image}
Ignored
Hi guys, where I can find this daily candle indicator?