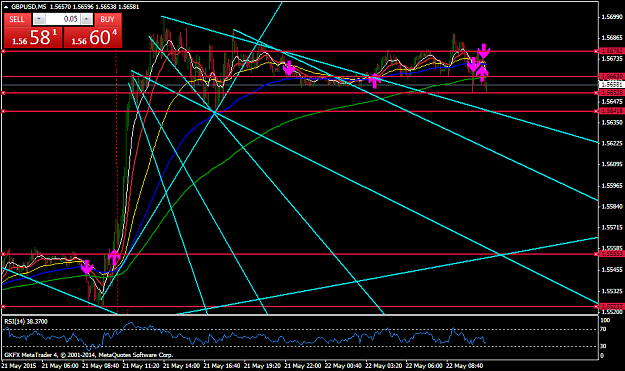
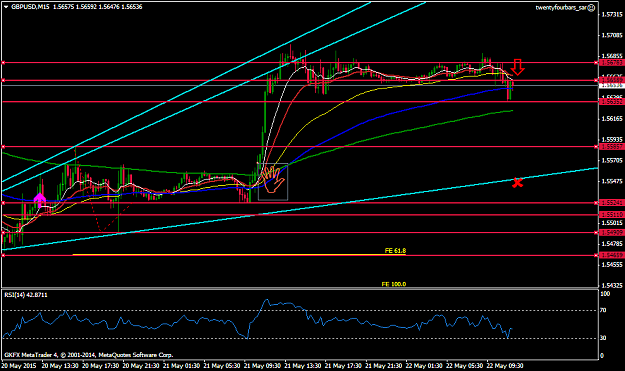
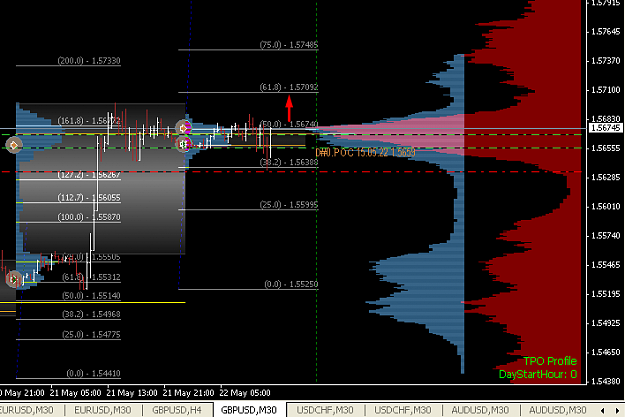
Hello all. Here is an update of my chart. I still expect the blue shaded areas to be reached, with the one on the most right-hand side offering what i see as the best R/R short.
There would be an interesting symmetry if price were to move down to touch 1.5585 and then continue up to my preferred 1.5775 (blue shaded, RHS): the leg up from 1.5585 to 1.5775 would then be of equal size to the first leg. I look for such symmetries (or "harmonics" as they are often called), for high R/R trades.
Other option I see is for price to keep creeping up to hit 1.5775 (red).
Of course the market may do none of that. This is what I see as most likely now. Therefore, if it move to the bottom orange circle, i will buy with a tight stop. If it moves to 1.5775, I will short with a tight stop.
Good pips to all
Attached Image (click to enlarge)