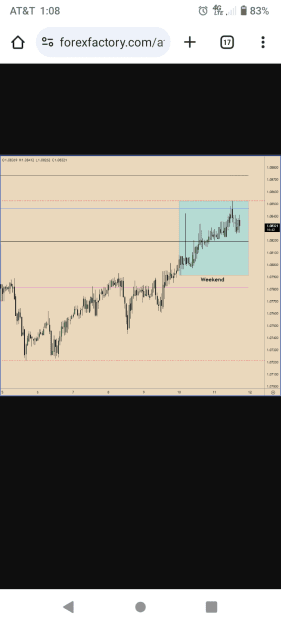
Disliked{quote} February 07, 2024 EURUSD How to Use FIBO Volatility levels? Here is full detail with chart and pending orders. On the chart, there are two lines. Blue and Pink. Price levels on blue line are for Buy Stop order. Price levels on pink line are for Sell Stop order. Blue line (Buy Stop order) start at the level of 0.236 ( you can check the price tag of each level on the chart). Pink line (Sell Stop Order) start at the level of 0.236 ( you can check the price tag of each level on the chart). Area between Blue line 0.236 and Pink line 0.236 is...Ignored
Love for all; Hatred for none.