Disliked{quote} Data got distorted while posting, it is actually in three excel columns. This is how levels were calculated: 1. Take high and low of the biggest move on weekly (Bull or Bear) 2. Take high and low of the 2nd biggest move 3. Take high and low of the3rd biggest move 4. Keep going, until you finish all bigger moves 5. Divide number of pips in each move by 2 or 4 or 8 or 16 or 32 (so that you get a sum close to 50 pips). Now keep on adding this sum to the lowest point of the move until you get the high, piling up the price levels for the move....Ignored
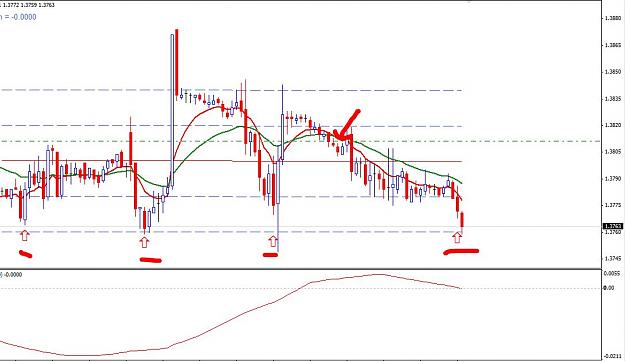
Already been through down move 1 and 2.
But what do 4559 and 4024 on move 1 and 3742, 3698, 3650 and 3429 on move 2 represent, please? Fibo's?