Hi everyone,
I'm starting this thread for the benefit of all for trade setups with 90%+- accuracy and reliability. When I say this I'm talking about posting trades with obvious levels of heavy support and resistance where not getting in seems like the dumbest thing to do. For the Negative Nancy's out there please dont scorn me on the 90% accuracy figure. With most of these trades you could atleast scalp for 20 pips, others have paid out hundreds of pips.
If you feel you have something please post but make sure your confidence level is way above average.
UPDATE October 25, 2013: Much has changed since this thread was started over 5 years ago, and indeed I realize I am rare in the sense of old timers even thinking about updating a thread that has such age to it. I'll cut to the chase: I basically halted updating this thread because I was getting slammed in terms of questions and requests. Anyone that has ever been in my shoes knows that it is not a fun position to be in, as you basically start to get insulted for not helping people, which is ridiculous as far as I or any rational person would be concerned. I was posting trades left and right until I found out that a decent number of FF readers were copying them, all the while mismanaging them in the process. I took down the thread performance record due to the sense that my regulators don't particularly care for me posting trades online, and I am not a fan of anything biting me in the butt in case the anonymity ever went away. Common sense if you ask me.
The blog was started in order to keep my writing alive, because I do and always have enjoyed it, while slowing down the inundations. It worked, and the site is alive, well and still going. I reply to pretty much every comment on the blog to answer questions - if I don't its just because I probably forget about it, but I do prefer it because it keeps everything organized and topics on point.
Everything listed on it is a completely free resource and there are heaps of materials posted on it now, all pretty much centric on price action. If you are looking for the important contents of just "get to the point" type of material, I assembled a "Best of the Blog" page where everything can be found, which you can find here.
I have been trading for, probably, way too long and I have had ups and downs like anyone else in terms of who I do business with and in trading itself. But FF has allowed me to basically work on empowering others with common sense, a quality seriously lacking in this industry. And I've been honored to be listed to on such a scale. And while it is impossible for me to void out a lack of control in everyone that reads what I write, I have earnestly hoped that at least a few people have gained value from what I have to say.
One of my favorite quotes is (probably cliche) but by Mark Twain:
So just get out of bed, do your work, exercise common sense, and
Thank you, and enjoy.
-------------------------------------------------------------------------
Blog: http://nobrainertrades.com
See below for important posts about this strategy, and a .pdf compilation
-------------------------------------------------------------------------
Important Posts - Nuts and Bolts of the Strategy Used Here
Full Blown Cache of Materials / Most Concise / Up To Date, Found Here: http://www.nobrainertrades.com/forex...inertrades-com
Strategy Overview (BRV) - http://www.forexfactory.com/showpost...&postcount=443
Reality Realization and Trader Reactions in Regards to Market Forces (BRV) - http://forexfactory.com/showpost.php...postcount=1615
Trade Planning and Mental Maintenance (BRV) - http://www.forexfactory.com/showpost...postcount=1420
Basic Math Behind Making the Most of Your Trades (BRV) - http://www.forexfactory.com/showpost...postcount=1253
Strong versus Weak Levels (BRV) - http://www.forexfactory.com/showpost...&postcount=779
Knowing if the Level will Hold/When to Fade, When Not to Fade (BRV) - http://www.forexfactory.com/showpost...&postcount=780
Measure Twice, Cut Once http://www.forexfactory.com/showpost...postcount=4716
Basic Approach Using Fundamentals and Sentiment to Determine Daily Market Direction (BRV) - http://www.forexfactory.com/showpost...postcount=4107
Fibonacci Extensions (BRV) - http://www.forexfactory.com/showpost...&postcount=781
Losing Trading FX (And a Simple Solution) - http://www.forexfactory.com/showpost...postcount=4453
About Diagonal Trendlines (BRV) - http://www.forexfactory.com/showpost...&postcount=787
Trade continuation (Ironman) - http://www.forexfactory.com/showpost...&postcount=153
Taking Profits (Ironman) - http://www.forexfactory.com/showpost...&postcount=609
Taking Profits (BRV) - http://www.forexfactory.com/showpost...&postcount=617
Taking Profits 2 (Ironman) - http://www.forexfactory.com/showpost...&postcount=324
Typical Day (BRV) - http://www.forexfactory.com/showpost...&postcount=329
AAA - The Missing Link - http://www.forexfactory.com/showpost...ostcount=12101
Trade Anatomy example (BRV) - http://www.forexfactory.com/showpost...&postcount=356
Entries and Exits (Ironman) - http://www.forexfactory.com/showpost...&postcount=164
Intraday Scalping (BRV) - http://www.forexfactory.com/showpost...&postcount=272
Intraday Scalping 2 (BRV) - http://www.forexfactory.com/showpost...&postcount=946
Intraday Scalping 3 (BRV) - http://forexfactory.com/showpost.php...postcount=3158
The Bottom of the Bucket - http://forexfactory.com/showpost.php...postcount=3156
Spike Base Pattern - http://www.forexfactory.com/showthre...se#post2758294
Over and Under Pattern - http://www.forexfactory.com/showthre...86429&page=803
1-2-3 Breakout! Pattern - http://www.forexfactory.com/showpost...ostcount=11820
Hourly Closes (BRV) - http://www.forexfactory.com/showpost...&postcount=274
The Most Profitable Traders - http://www.forexfactory.com/news.php?do=news&id=95528
-------------------------------------------------------------------------
Here are some on the way or in progress:
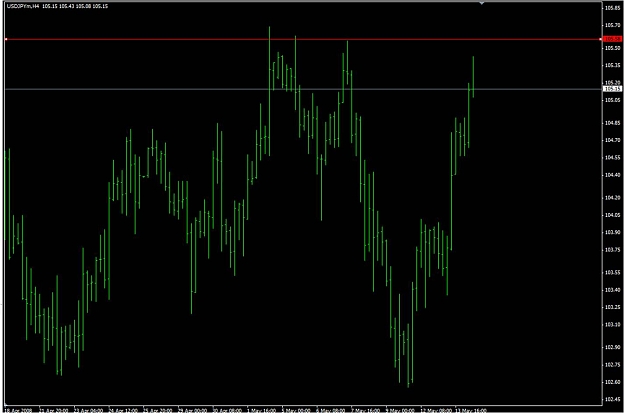
USD/JPY short, 105.70 to 105.60
hit it 3 times and made a nice bounce everytime, expecting the same to happen today or tomorrow if price makes it up there. Shorting lower level resistance at 104.44 is paying out about 25 pips right now.
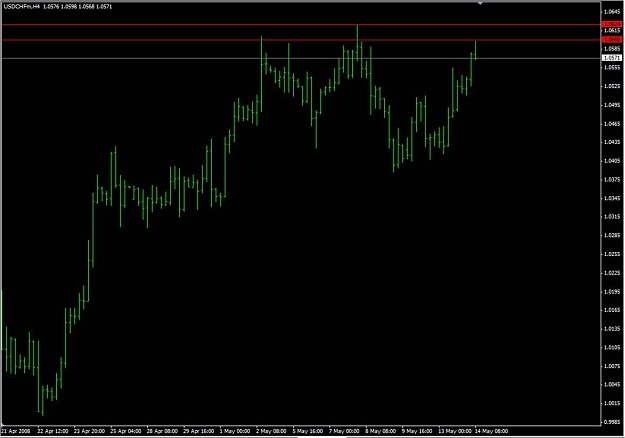
USD/CHF short, 1.0630 to 1.0620
high of the recent s/r levels. Right now its bouncing off of 1.0600 resistance giving a good 30pip payout
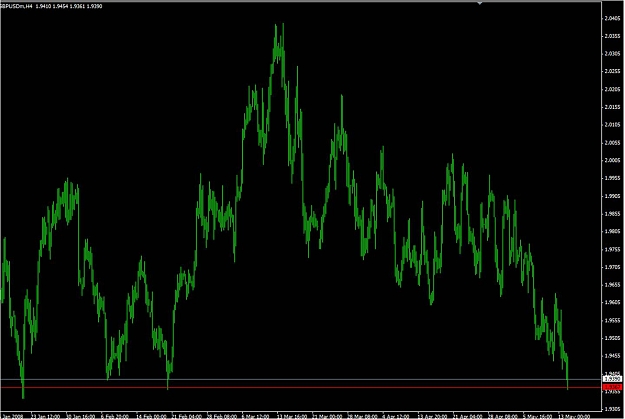
GBP/USD long, 1.9362 to 1.9388
this one is in progress but here for demonstration...about 40 pips so far. Another opportunity for a long is coming at 1.9337
Thanks, please keep them coming. I'm generally very busy but if I have the time to post I'll be sure to.
I'm starting this thread for the benefit of all for trade setups with 90%+- accuracy and reliability. When I say this I'm talking about posting trades with obvious levels of heavy support and resistance where not getting in seems like the dumbest thing to do. For the Negative Nancy's out there please dont scorn me on the 90% accuracy figure. With most of these trades you could atleast scalp for 20 pips, others have paid out hundreds of pips.
If you feel you have something please post but make sure your confidence level is way above average.
---------------------------------------------------------------------
UPDATE October 25, 2013: Much has changed since this thread was started over 5 years ago, and indeed I realize I am rare in the sense of old timers even thinking about updating a thread that has such age to it. I'll cut to the chase: I basically halted updating this thread because I was getting slammed in terms of questions and requests. Anyone that has ever been in my shoes knows that it is not a fun position to be in, as you basically start to get insulted for not helping people, which is ridiculous as far as I or any rational person would be concerned. I was posting trades left and right until I found out that a decent number of FF readers were copying them, all the while mismanaging them in the process. I took down the thread performance record due to the sense that my regulators don't particularly care for me posting trades online, and I am not a fan of anything biting me in the butt in case the anonymity ever went away. Common sense if you ask me.
The blog was started in order to keep my writing alive, because I do and always have enjoyed it, while slowing down the inundations. It worked, and the site is alive, well and still going. I reply to pretty much every comment on the blog to answer questions - if I don't its just because I probably forget about it, but I do prefer it because it keeps everything organized and topics on point.
Everything listed on it is a completely free resource and there are heaps of materials posted on it now, all pretty much centric on price action. If you are looking for the important contents of just "get to the point" type of material, I assembled a "Best of the Blog" page where everything can be found, which you can find here.
I have been trading for, probably, way too long and I have had ups and downs like anyone else in terms of who I do business with and in trading itself. But FF has allowed me to basically work on empowering others with common sense, a quality seriously lacking in this industry. And I've been honored to be listed to on such a scale. And while it is impossible for me to void out a lack of control in everyone that reads what I write, I have earnestly hoped that at least a few people have gained value from what I have to say.
One of my favorite quotes is (probably cliche) but by Mark Twain:
QuoteDislikedDon't go around saying the world owes you a living. The world owes you nothing. It was here first.
So just get out of bed, do your work, exercise common sense, and
QuoteDislikedTake the easy ones, and don't do anything stupid in the meantime.
Thank you, and enjoy.
-------------------------------------------------------------------------
Blog: http://nobrainertrades.com
See below for important posts about this strategy, and a .pdf compilation
-------------------------------------------------------------------------
Important Posts - Nuts and Bolts of the Strategy Used Here
Full Blown Cache of Materials / Most Concise / Up To Date, Found Here: http://www.nobrainertrades.com/forex...inertrades-com
Strategy Overview (BRV) - http://www.forexfactory.com/showpost...&postcount=443
Reality Realization and Trader Reactions in Regards to Market Forces (BRV) - http://forexfactory.com/showpost.php...postcount=1615
Trade Planning and Mental Maintenance (BRV) - http://www.forexfactory.com/showpost...postcount=1420
Basic Math Behind Making the Most of Your Trades (BRV) - http://www.forexfactory.com/showpost...postcount=1253
Strong versus Weak Levels (BRV) - http://www.forexfactory.com/showpost...&postcount=779
Knowing if the Level will Hold/When to Fade, When Not to Fade (BRV) - http://www.forexfactory.com/showpost...&postcount=780
Measure Twice, Cut Once http://www.forexfactory.com/showpost...postcount=4716
Basic Approach Using Fundamentals and Sentiment to Determine Daily Market Direction (BRV) - http://www.forexfactory.com/showpost...postcount=4107
Fibonacci Extensions (BRV) - http://www.forexfactory.com/showpost...&postcount=781
Losing Trading FX (And a Simple Solution) - http://www.forexfactory.com/showpost...postcount=4453
About Diagonal Trendlines (BRV) - http://www.forexfactory.com/showpost...&postcount=787
Trade continuation (Ironman) - http://www.forexfactory.com/showpost...&postcount=153
Taking Profits (Ironman) - http://www.forexfactory.com/showpost...&postcount=609
Taking Profits (BRV) - http://www.forexfactory.com/showpost...&postcount=617
Taking Profits 2 (Ironman) - http://www.forexfactory.com/showpost...&postcount=324
Typical Day (BRV) - http://www.forexfactory.com/showpost...&postcount=329
AAA - The Missing Link - http://www.forexfactory.com/showpost...ostcount=12101
Trade Anatomy example (BRV) - http://www.forexfactory.com/showpost...&postcount=356
Entries and Exits (Ironman) - http://www.forexfactory.com/showpost...&postcount=164
Intraday Scalping (BRV) - http://www.forexfactory.com/showpost...&postcount=272
Intraday Scalping 2 (BRV) - http://www.forexfactory.com/showpost...&postcount=946
Intraday Scalping 3 (BRV) - http://forexfactory.com/showpost.php...postcount=3158
The Bottom of the Bucket - http://forexfactory.com/showpost.php...postcount=3156
Spike Base Pattern - http://www.forexfactory.com/showthre...se#post2758294
Over and Under Pattern - http://www.forexfactory.com/showthre...86429&page=803
1-2-3 Breakout! Pattern - http://www.forexfactory.com/showpost...ostcount=11820
Hourly Closes (BRV) - http://www.forexfactory.com/showpost...&postcount=274
The Most Profitable Traders - http://www.forexfactory.com/news.php?do=news&id=95528
-------------------------------------------------------------------------
Here are some on the way or in progress:
USD/JPY short, 105.70 to 105.60
hit it 3 times and made a nice bounce everytime, expecting the same to happen today or tomorrow if price makes it up there. Shorting lower level resistance at 104.44 is paying out about 25 pips right now.
USD/CHF short, 1.0630 to 1.0620
high of the recent s/r levels. Right now its bouncing off of 1.0600 resistance giving a good 30pip payout
GBP/USD long, 1.9362 to 1.9388
this one is in progress but here for demonstration...about 40 pips so far. Another opportunity for a long is coming at 1.9337
Thanks, please keep them coming. I'm generally very busy but if I have the time to post I'll be sure to.
Attached Image(s) (click to enlarge)
Attached File(s)