Home
Search Forums
Keywords:
Search Titles Only
User Name:
Exact Match
Show Results As:
Advanced Options
Reply
 
Thread Tools Search this Thread
  #1  
Old Nov 12, 2007 12:25am
capitalist88's Avatar
Math Geek in Training
 
Member Since Oct 2006
More than 10 Vouchers  757 Posts
Cool Caution: Math Geek at Work

:wave: Hello all! I'm Scott, better known at various places around the net as "Capitalist." I've been a long-time lurker and infrequent poster on Forex Factory, and have always enjoyed reading through the in-depth intelligent discussions to be found here. I used to have a trading blog attached to my own website, but it was kind of like talking to myself in the desert so I decided to move my musings over here to where all the action is.

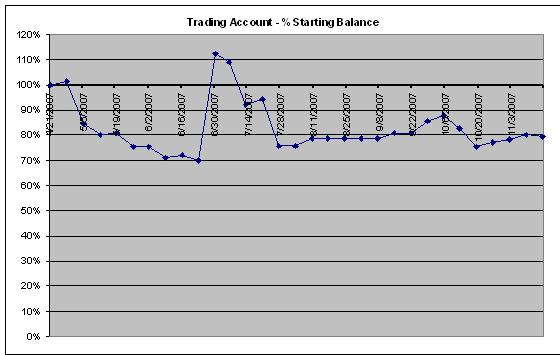
I used to be a registered rep at Fidelity and have traded stocks, fixed income, equity options and index options at various times and with mixed results. I discovered FOREX in 2004 and promptly blew up a small live account. I did some demo trading for a while and am again trading live with a small account. This year I took a trading course (offered by one of the members here) which helped me out a lot. After losing consistently in FOREX I am now finding myself with enough winning trades to at least keep my account at close to B/E.

I have a degree in engineering and a very analytical mindset, so it's no surprise that I have often approached trading from a statistical, mechanical standpoint. However, oddly enough, the course which improved my performance the most used a discretionary approach based on understanding trends and reading price action. I don't follow the methods in the course I took exactly, because the trading style does not suit me, but I am incorporating a lot of the concepts into my own style. In the next post I'll discuss the method I'm currently developing.
__________________
"To the fearless mind. To the inviolate truth."
-Ayn Rand

Last edited by capitalist88, Jan 1, 2010 3:45pm Reason: font size
Reply With Quote
  #2  
Old Nov 12, 2007 2:45am
capitalist88's Avatar
Math Geek in Training
 
Member Since Oct 2006
More than 10 Vouchers  757 Posts
Default Current method

The system I'm currently exploring involves scaling into a position over time in small increments in order to catch large long-term trends with a low probability of being shaken out. Some of the features are:
  • Trend following
  • Entries based on price action
  • "Set it and forget it" trade management dynamic
My underlying concept for this method is that a journey of 1,000 days begins with a single pip. Every huge move starts off as a small one at first. The trick, as Jesse Livermore liked to point out, was to turn small profits into large ones by just sitting and letting them go. So while most of my trades may end up being stopped out at small profits or losses, my goal is to develop some of them into very large long-term wins.

Conventional wisdom is that this approach involves two conflicting goals. On the one hand, I want to keep my risk low. On the other, I want to capture very large long-term moves which means wide stops and more risk. The solution to this is small position size of course, and since I trade with Oanda I have a lot of flexibility when it comes to position size.

So my initial position will be very small, with a wide stop. I will manage profitable trades in such a way as to balance three incompatible goals; adding to my position, trailing the stop and widening the stop. I'll provide an example of how this works below, but first I'll discuss the entry.

Entry

Starting with a daily chart, I look for a trend based on the relative positions of three moving averages. I use SMA34, SMA55 and SMA144. For an uptrend, the price must be above the 34, the 34 above the 55 and the 55 above the 144. Not rocket science. This actually comes from the trading course I took except that I changed the periods to Fibs because I'm a math geek. I'm not building a Swiss watch, so the specific periods don't matter much to me anyway. If there is no trend on the daily I drop down to the 3-hour and then the hourly. I don't look any lower than that for a main trend.

Anyway, if there's a trend then I go down into the next lower TF (sometimes I have to dig a bit lower) to see the detail. This is where I use price action to place the entry. Again, nothing original here; all I do is place the entry beyond the most recent swing high/low. This assumes that the main trend is intact at this level, i.e. making higher highs and higher lows for an uptrend. Sometimes the main trend will be retracing, so at the lower TF I see a counter trend. All I do then is just throw a trendline on the chart, and leave it until the counter trendline has been broken and the price is moving back in the direction of the main trend again. Then I do the same old order placement beyond the most recent swing.

This is probably clear to some but not so to others so I'll put a chart up in my next post.

The stop

It's the management of the stop which is the key to this method. Initially I put the stop in the obvious place, which is behind the last pullback. With daily/3hr TF this may be a couple of hundred pips. I start with a small enough entry that this represents only 1-2% of my account value. Then the fun begins.

Some trades will be stopped out of course, but for now I want to consider those that continue to move in my direction. For clarity, I'll assume an uptrend for the rest of this description. I have three goals as the price continues to rise:
  1. Add to my position at new entry points. I assume that each new additional unit is the same size.
  2. Raise my stop to and eventually above my average entry price (AEP)
  3. Never to reduce the distance between the highest price attained and the stop. In fact, I want to widen that distance over the life of the trade.
The first thing I do is to trail the stop behind price until it reaches B/E. I never let it drop below B/E from that point on. So this means that I can't add to the second unit until the trade has become profitable by the amount of my initial stop. Here's an example:

Buy EUR/USD at 1.4400 with a SL at 1.4300. I trail the stop behind the price until the price gets all the way up to 1.4500. At this point, my stop is at 1.4400 at B/E and I have 100 pip unrealized profit. It's only at this point that I will look for another entry, and that entry must be at or above 1.4500. This is because when I buy the next unit, the AEP will rise to a point 1/2 way between the first buy and the second buy.

For example, if I buy my next unit right at 1.4500, my AEP will now be (1.43 + 1.45)/2 = 1.4400. That's where my stop is, so I'm still ok. What I don't want to have happen is my AEP to move above my stop, leaving me exposed to a loss. Once I am at B/E I never want to go below that level.

What if I didn't get my second entry until 1.4600 for example? That would be ok. My AEP would be (1.43 + 1.46)/2 = 1.4450. But remember that I'm trailing my stop behind the price by 100 pips at this point, so the stop would be up at 1.4500 now. My stop is still 100 pips away from the price, and I have 50 pips locked in.

Notice too that in both of these examples that I have given up some or all of my original unrealized profit. This is unavoidable when adding to a profitable position. I have essentially "spent" my profit to get a larger position. Fortunately, the effect on the AEP will be less and less for each additional new unit.

Assuming that this trade continues to advance into profitable territory, I will continue to move the stop up behind it, but not pip for pip like I was doing before. Now I'll keep the stop at a point halfway between the highest price attained and the AEP, subject to the rule that I must never DECREASE the distance from the highest price to the stop. I am only allowed to widen that distance, thus constantly reducing the probability that the trade gets stopped out.

This rule will crop up when I add new units to the trade. That pushes the AEP up toward the price, and if I kept to just the 50% rule, I would find myself pushing the stop too close to the price. So I forgo the 50% rule in favor of the "NEVER TIGHTEN RULE." This means that whenever I increase the position size, I have to "spend" some of my previously locked in profit in order to keep the stop from getting too close to the price.

Exit

Yes, the trade will have an exit at some point. When the main trend begins to break down, I will begin actually tightening the stop by abandoning the 50% rule. As the SMAs that define the trend begin to cross each other in the wrong direction, I will use each such crossing event to push my stop to 60% then 70% etc. from the AEP to the price. As the 34 crosses the 55 and the 144 and the 55 crosses below the 144 I will be pushing the stop up aggressively because the party's over at that point.

Whew! Is this post done yet? Anyway, I'll report on my progress. Out here...

Cap


__________________
"To the fearless mind. To the inviolate truth."
-Ayn Rand
Reply With Quote
  #3  
Old Nov 12, 2007 10:45pm
capitalist88's Avatar
Math Geek in Training
 
Member Since Oct 2006
More than 10 Vouchers  757 Posts
Default A typical entry

Cap: Correct me if I'm wrong, but this is the beginning of a trend.

The Market: You're wrong. That was me...correcting you.

:

Anyway, if I can get this chart to post, this is a typical entry.
Attached Thumbnails
Click image for larger version

Name:	TypicalEntry.JPG
Views:	420
Size:	61.2 KB
ID:	65595    
__________________
"To the fearless mind. To the inviolate truth."
-Ayn Rand
Reply With Quote
  #4  
Old Nov 12, 2007 11:11pm
capitalist88's Avatar
Math Geek in Training
 
Member Since Oct 2006
More than 10 Vouchers  757 Posts
Default Initial results

I started this process last week and it's running a loss so far, but of course it's only been a couple of days.

I follow nine pairs. I keep track of what's happening in each with an Excel spreadsheet. The trend may be my friend, but Excel is my confidant, my paramour...my partner in crimeeee!!!! errr, sorry about that. Anyway, my daily trading routine consists of checking the status of each pair and just adjusting/placing orders as required by the strategy:
  1. If I can't find a trend in the top three time-frames, I stay out.
  2. If I find a trend but it's retracing, I put a trendline on the retrace and leave it until the next day to see if the main trend resumes.
  3. If the trend is intact and I don't have a position yet I will place an entry order like the one in the last post.
  4. If I find that I've entered a position I will trail the stop based on the highest profit "watermark" achieved so far. I also put a boundary line on the chart to show me where the next acceptable entry can be. Price has to have moved past this point for me to be able to set another entry order.
So far, I have had six closed trades of which only only one was slightly profitable. The total loss for all six is 471 pips, or about 80 pips per trade. This may sound like a lot, but it's not. Remember, these initial positions are very small. I haven't doubled up any positions yet.

As of tonight, I have open positions in 3 pairs:
  • Short EUR/CHF up 111 pips
  • Short USD/JPY up 196 pips
  • Short NZD/USD down 28 pips
I also have an unfilled short order on USD/CHF at 1.1170. What about the other 5 pairs you ask? Those all have trends, but they also are retracing. I'm waiting for the retracement trendlines to be broken.

This is a "set and forget" type of process, so I don't sit here all night watching what happens. My favorite trading tool recently has turned out to be the little red "X" on my Oanda platform. I've already adjusted my stops for the night, so I'll come back tomorrow to see how it's going.

Out here...
__________________
"To the fearless mind. To the inviolate truth."
-Ayn Rand
Reply With Quote
  #5  
Old Nov 17, 2007 6:39pm
capitalist88's Avatar
Math Geek in Training
 
Member Since Oct 2006
More than 10 Vouchers  757 Posts
Default Getting organized

Hello again Trading Journal! :

How was your week? Mine was just zippy.

I didn't do much trading this week and my account balance ended down about 0.8%. Below is a chart of my live account performance since inception. As you can see, I've been hovering between 70% and 80% of the initial account value for a long time, with only a brief profitable period (from a long-term AUD/JPY carry trade) in the first couple of months.

I guess I've reached some sort of "next level" in my trading wizard training at which at least I know enough not to blow up my account, and can manage to tread water even if I'm not yet making any consistent profits.

Name:  tradinghistory.JPG
Views: 5008
Size:  31.1 KB

While I was working on the scaling-in method that I originally posted about, I found myself pursuing several different avenues of thought at once, from new systems development to money management philosophy to which indicators to keep/discard/change etc. I also started exploring FF during the week so of course that opened up a flood of new ideas as well.

Now this kind of thing is always dangerous if it gets out of control. Some traders will end up system hopping in their trading which can be destructive to one's account balance. I used to do that, but now my response to a period of confusion and disorganization is to go into "analysis paralysis" mode. While this certainly degrades my productivity, at least it doesn't affect my capital!

So anyway, now the weekend is here and I can start organizing and applying some of the information I've gained over the past week. Here are some issues I'm grappling with.

1. Trading session dynamics: I haven't quite gotten a handle on what works well for me. Do I go through an extensive analysis and planning procedure before each session, and then spend the session glued to my screen waiting for the right setups and signals? Do I want to simply trade each session independently (daytrading) so that I have immediate performance feedback each day? Can I set up a longer term "set and forget" system that I only have to maintain periodically like the one I discussed in my previous posts? This doesn't give a high enough frequency of feedback for me though. But wasting day after day watching the screen for a setup that may never materialize? Sigh... gotta think about this.

2. Timeframe: I constantly swing back and forth on this one. The advantage of longer TFs is less spread cost. Price action is supposed to make more sense too, but I don't really see that. I have seen 1-min and 5-min charts that are much less choppy than some daily charts. Also, even with the spread consideration, the math is really on the side of shorter time frames. Look at 200 days of a daily chart and you may see a total range of around 1000 pips, which is the maximum a "perfect" long range trader could have made during that time. That's an average of 5 pips a day. But each price bar is 50 pips high! Even if a trader can only manage to pull an average of 20% of each day's range out of the market, that daytrader beats the "perfect" long term trader.

Regardless of the arguments, I think the bottom line is that I need to trade whatever TF the setup is on. Let the charts tell me what TF to use in any given trade. This issue is very much tied up with the "session dynamics" one.

3. Indicators/systems: It's very easy to all bolloxed up over this one, especially with so many diametrically opposed opinions. It's like a political debate between two opposing sides; you have all these extremists running around shouting "trade naked now!" or "pile on more Fiboexponentialalidocious Macdomentum lines now!"

Being a math geek, I used to like coming up with new and original indicators, but realized a long time ago that any indicator is a derivative of price movement, and thus all the information in the indicator is in the price. But I don't see that as a reason to dump them all. Suppose I think it's important to know if prices are above their average level over the past 10 days or not. Should I really have to add up all the price closes and divide by 10 every time? Or should I save time by throwing a nice 10-period SMA up on the chart? Trade naked indeed. YOU trade naked, I'll save time, LOL.

So my current thinking on this is moderate. I like a couple of moving averages to provide some context on the chart, an objective way to define a trend, and a reference line to determine the strength of pullbacks. I use Fibs as measuring tools as well, but I don't keep them on the chart. Same with ATR; I call it up when I want to estimate where I should set stops, etc., but then I put it away.

Finally, what about oscillators? I had kind of sworn them off after I took Hector's (WTB) trading course, but that's not the only method/system I use. There is one thing that I've always liked about oscillators, and that is the value of divergence as a leading indicator. Divergence is not something that is readily apparent in price action (although it's hidden in there somewhere of course). Just yesterday I discovered the distinction between "classical" divergence with which I've been familiar for years, and "hidden" divergence. Just goes to show ya...there's always something you don't know. So anyway, I'm welcoming the old basic oscillator (RSI, Stochs, MACD) back into my toolbox.

4. Systems: I started another thread on this a few days ago. The upshot was that I don't want to have a bunch of different systems just because each one may seem cool or logical whatever. If I develop a system or use one that's out there, it has to be for the purpose of solving some particular problem. For example, if I'm trading one system where there is a lot of downtime between good setups, I might want to find an additional system to "fill the gaps." Maybe something very short term, or an "always in" type of system. As another example, if my situation changes and I have less free time to monitor the market, I may need a "set and forget" type of system to solve the problem.

Speaking of systems, the one I was working on had a major conceptual problem (trying to stay in a long term trend while constantly building up a position leads to extreme drawdowns), so I have stopped working on it.

5. Money Management: I'm still working on the scaling-in approach though, and am playing with a couple of concepts.

One is the "bring stop to B/E then trail it by 1/2 the slope of the price increase." This moves the stop forward, locking in more profit over time, while increasing the absolute distance from the price as well, lowering the probability of a shakeout. Adding to the position is a problem though. In order to keept the average entry price from overtaking the stop, additional entries must be either very far apart or very small. Small entries allow me to take advantage of every "add signal" though, so I'm leaning in that direction.

The other concept I'm playing with is front end loading of the entry sizes. Basically, if I add three units each at 1.41, 1.42, 1.43, 1.44 and 1.45, then I will have 15 units at an average entry price of 1.4300. But if I add the 15 units in this order instead {5,4,3,2,1}, then my average entry price will only be 1.4233, or an advantage of 67 pips on 15 units. Not too shabby.

Well, that's it for now. For any Twin Peaks fans out there, I'm heading out now for a damn fine cup of coffee.


EDIT: Well ok, I managed to get the chart in the middle of the post where I wanted it, but I have no idea how to eliminate the one at the bottom. Bizarre.

EDIT AGAIN: Ha!!!!! Got the chart in the right place now. I won, LOL.
__________________
"To the fearless mind. To the inviolate truth."
-Ayn Rand

Last edited by capitalist88, Nov 17, 2007 7:32pm
Reply With Quote
  #6  
Old Nov 17, 2007 7:06pm
trader101's Avatar
Commercial Member
 
Member Since Dec 2006
Default Hello

Hello there trader friend...
I like your style of trading similar to mine. I know that you are struggling now but soon you will perfect your style and will be ahead. Like I am only trading 10 pairs. Pairs that usually trend simultaneously. You are using a daily candle which is good. Right now that is what i am tryiing to learn. The problem with the daily is the large amount of drawdown. It is easy to catch a trend in a daily frame but even with the right trend a couple days may put you in red before if goes back to green. I suggest you use a 4hour time frame for catching trend and use 5 min for watching trend reversal, this way you can stay out of trade before it completly damage your trade.
Anyways..Good luck to your trading and more pips to you...
Trader101
Reply With Quote
  #7  
Old Nov 17, 2007 7:06pm
capitalist88's Avatar
Math Geek in Training
 
Member Since Oct 2006
More than 10 Vouchers  757 Posts
Default Posting images

Well, I thought I knew how to post images, but now every time I try to add one it ends up at the bottom of the post. Trying to get to go where the curser actually is....
__________________
"To the fearless mind. To the inviolate truth."
-Ayn Rand
Reply With Quote
  #8  
Old Nov 17, 2007 7:18pm
capitalist88's Avatar
Math Geek in Training
 
Member Since Oct 2006
More than 10 Vouchers  757 Posts
Default

Quote:
Originally Posted by trader101 View Post
Hello there trader friend...
I like your style of trading similar to mine. I know that you are struggling now but soon you will perfect your style and will be ahead. Like I am only trading 10 pairs. Pairs that usually trend simultaneously. You are using a daily candle which is good. Right now that is what i am tryiing to learn. The problem with the daily is the large amount of drawdown. It is easy to catch a trend in a daily frame but even with the right trend a couple days may put you in red before if goes back to green. I suggest you use a 4hour time frame for catching trend and use 5 min for watching trend reversal, this way you can stay out of trade before it completly damage your trade.
Anyways..Good luck to your trading and more pips to you...
Trader101

Thanks!
__________________
"To the fearless mind. To the inviolate truth."
-Ayn Rand
Reply With Quote
  #9  
Old Nov 18, 2007 1:38am
capitalist88's Avatar
Math Geek in Training
 
Member Since Oct 2006
More than 10 Vouchers  757 Posts
Lightbulb Scaling-in math

This is a DAMN fine cup of coffee!


Ok, there's a lot of stuff happening. I just did a bunch of analysis work on AUD/USD which I'll discuss in the next post. I'm getting organized. Things are starting to gel. Math geek or not, I think I may be more cut out for discretionary trading than mechanical system trading. But more on that later.

I've decided on the technique I want to use for scaling into a position so I'll devote this post to a discussion on that. The reason I like the scaling-in idea in the first place is that it has HUGE potential to turn a small winning trade into a large long term mega-winner if you catch a strong trend. That's because after you finish your initial scaling-in plan, you can consider your whole position as the first step in a NEW LARGER scaling-in plan. This is that whole fractal/recursion thing that we math geeks love so much.

In order to make that work, you have to make sure that the sum of your scaling-in series is evenly divisible by the first number in the series. So for example, suppose I like to enter a position in three steps by buying 3 units, then 2, then 1 unit. The series is 3,2,1. This works because this sums up to 6, and 6 is evenly divisible by 3, the first number in the series. This is important because now that you have 6 units, you can think of that as having 3 {UNITS of 2}. So now you can complete the last two steps in the series again (assuming the trade is still going your way) by entering with 4 more units, then 2 units. So now you have a total of 12, but you can think of this as 3 {units of 4}. And so on. So your entries would look like this:

Start: 3 + 2 + 1 = 6
Trade going my way: I already have 6 + 4 + 2 = 12
Trade going my way: I already have 12 + 8 + 4 = 24
Trade going my way: I already have 24 + 16 + 8 = 48

Notice that you're doubling up your position each time. Of course the time intervals might be longer. Your first 6 units might be entered in a day, the second 6 by the end of the week, 12 more over the next couple of weeks, and so forth. Obviously this sort of thing won't happen very often. It requires that you've caught a strong trend and managed not to get shaken out of it.

Anyway, that's the potential I see in scaling in recursively. It's like letting your profits run on steroids! I'll mention here that even though I learned a lot from the trading course I took recently (shout out to Hector! ) and had a lot of "eureka! moments," I don't do everything the way he does. I am not a huge fan of setting a TP on a trade for example. It either eventually hits my trailing stop (almost all the time) or it keeps running and I keep adding to it. Mathematically, I like the open-ended distribution curve. There's a lot of area under that infinitely long thin profit side tail you know!

Ok, back to the scaling in math. Keeping on with the concept above, notice that an entry series of 4,3,2,1 doesn't work as well. When you get finished, you've got 10 units, but that's not a multiple of 4, so if you want to consider this 10 units to be the first 4 units in a new series you have to start dealing with fractions. Bleh. The series 5,4,3,2,1 works well though, because it adds up to 15 which is divisible by 5. So once you get the 15 units, you can consider that to be 5 "triple units" which is the start of a new series.

I wouldn't go any higher than a series of 5 entries though. So I either do a 3,2,1 scale-in or a 5,4,3,2,1 scale-in. Which one I choose depends on my analysis of the trade. For example, the long AUD/USD trade I'm looking at has three key areas of resistance to go through. If it goes through the first, I'll buy 3 units, if it breeches the second I'll buy two, and if it gets through the last one I'll buy the last unit for a total of 6. I've set the three entries up so that they're equidistant, but this isn't strictly necessary.

The reason that I take the biggest entries first, as I've mentioned in a previous post, is because it moves my average entry price to my side of the average market price (assuming all entries are hit). For example, my three buys on AUD/USD are set like this:

buy 3 at 0.8960
buy 2 at 0.9040
buy 1 at 0.9120

The average market price is the middle of these three, or 0.9040. However, the average entry price for me will be only 0.9014 or an improvement of 26 pips on 6 units. This is similar to the logic behind dollar cost averaging.

I set the same stop on all three entry orders at 0.8920 which is behind a major support area (details in the next post). So if all three orders are filled, and it falls back to my stop, my risk is 0.9014 - 0.8920 = 94 pips. Yeah, whatever. Call it 100 pips; I'm not building a watch here... :

So now finally I can calculate my order size. I'll use made up numbers for this part. Suppose my account size is $10,000. I'm going to risk about 3% of my account on this one, so that's $300. The risk is 100 pips/unit x 6 units = 600 total pips, so this 600 pips has to be equal to $300. That means the risk per 1 pip = $300/600 = $0.50. This is an order size of 5,000 AUD/USD. So the three orders would be for 15,000, 10,000 and 5,000. I use Oanda so this sort of flexibility is possible. Your mileage may vary.

Whew! So that's the method I use for scaling into a position and setting order sizes. It takes about a tenth of the time to actually do it than it does to write about it in this post, LOL! It's way too late for me now, so I'll post about how I analyzed the AUD/USD trade when I get up tomorrow.

__________________
"To the fearless mind. To the inviolate truth."
-Ayn Rand
Reply With Quote
  #10  
Old Nov 18, 2007 4:11pm
capitalist88's Avatar
Math Geek in Training
 
Member Since Oct 2006
More than 10 Vouchers  757 Posts
Lightbulb Analysis Process

Yawn!!!! I'm up. Had breakfast, read through some FF posts and now on my second cup of coffee >>> C\_/

The Sydney market opens in an hour or two, and I've already got a trading plan and some orders set up for AUD/USD. In this post I'll go through the process I used to analyze the AUD/USD.

First of all I'll point out that I'm trying different approaches to trading to see what's the most comfortable. The process I used on this AUD/USD trade involved a couple of hours of analysis and resulted in a discretionary trade. I found that after all the work was done, I was very confident in the method. Even if this trade doesn't work out, the analysis process seems very solid to me at this point.

The disadvantages to this approach that I see right now are that it looks time consuming and I will not get frequent performance feedback due to the TF of the trade. The time consuming part was mainly caused by the fact that I was developing my analysis process as I was doing it, so in the future I don't expect it to take nearly as long to analyze a single pair. The lack of frequent performance is something I'll have to address by setting up a separate approach that deals with intraday trading. That will be my project for this coming week.

So anyway, back to the AUD/USD. First of all, how did I choose this particular pair? It was easy. My goal was to analyze all nine pairs that I follow, and since I list them alpabetically on my analysis spreadsheet I started with the first one; AUD/USD. And that took so much time that I didn't do any others! :

First I developed a little checklist of all the methods and tools I like to use to look at a pair. Most are technical but some are fundamental. I look at the daily time frame for a long-term view then at a 30-min chart to get a view of the past few days, applying my technical tools in both cases. So I apply all these various tools to the pair, but I realize that some may not tell me anything useful. It's like a fishing expedition. As I apply the tools one after the other, hopefully a consistent picture emerges. Price starts to "tell me a story" about what it's doing, and I get a strong impression of what it may be about to do. But there's no mechanical process to this; it's more like detective work.

Here are the tools I like to use, and how I applied each to the analysis:

1. Cumulative news effect: This is something I set up on Excel to keep track of the pressures on each pair from ongoing economic releases. I keep a running index for each currency, and when a new release comes out I add or subtract to that index depending on the importance of the release and where it was in relation to last month's release and the forecast. This is partly based on some research I did into the effects of news (available in the archives on my site). This allows me to rank the pairs in terms of what's happening fundamentally. The AUD/USD is ranked third from the top right now.

2. Interest rate differentials: I keep track of these on Excel too and always check to see if I'm against the cash flow. If so, I will generally be more agressive about moving my stops up over time so the position either has to perform or go away. If I'm with the IRD then that's just icing on the cake. AUD/USD has a long IRD of +2.25%, so I will be impatient with any short position.

3. Pending News: This is more for shorter term trades where I want to be out during a release. For longer term trades it's not such a big deal but I may want to be at the screen during major releases. The first significant release for AUD/USD is some U.S. news on housing at noon tomorrow.

4. Trends by Timeframe: I use two SMA's to identify major trends in each TF. If the price is above the SMA34 and the 34 is above the 144 that's an uptrend. If the price has dipped below the 34, then it's an uptrend with a pullback, etc. I color code this in three different timeframes (daily, 3-hour and 30-min) on Excel to keep track of them at a glance. For the AUD/USD, the daily trend is up with a pullback, the 3 hour trend is down with a pullback and there is no trend on the 30-minute.

So now this pair is starting to tell me a story, but it's still a confusing one. Fundamentally it's pretty strong and it's been in a long term uptrend. There has been a major pullback over the past few weeks, but over the past several days the bulls have stopped that pullback. Now it's struggling to go back up. Will it succeed or will the major pullback continue and develop into a major bear trend?

5. Look for confluence levels on daily and 30-min TF: Lines based on daily chart analysis are in yellow and lines based on the shorter TF are in purple so I can tell them apart. I draw the high and low of the previous and current week as well as the previous day. I add any major trend lines, patterns such as triangles, ranges, flags, head & shoulder necklines, support & resistance levels, major swing highs and lows. If any of the horizontal lines are near round numbers like 0.9100, I place a line there as well.

Then I apply Fibo retracement lines to the major swings on the charts to see if any of the Fib levels are near any of the other lines I've drawn. If so, I place a dashed horizontal line at the interesting Fib level, but I delete the rest of the Fib lines.

Now at this point I'm starting to clutter up my chart with lines, but it's not going to stay cluttered. What I'm looking for is areas where a bunch of lines tend to cluster together; confluence areas. I keep those clustered lines on the charts, and begin deleting most of the other lines I've drawn which are hanging out there by themselves.

When I get done with this, I can zoom into the 30 minute TF and see a "landscape" of the price. Here's what I have for the AUD/USD:

Name:  Landscape.JPG
Views: 4926
Size:  56.9 KB

The yellow lines are from the daily TF and I can see that price is inside a big triangle formed there. Looking at the purple lines based on the lower TF I see that price is in an ascending right triangle with its top defined by a heavy area of resistance at around 0.8940. There is a heavy area of support down at about 0.8850. In between these two levels we can see that price is climbing up, having found some support at two separate Fibo lines (the dashed ones).

Note that I don't really remember where each horizontal line on the chart comes from anymore. All I know is that I put each one there for a reason, and a bunch of them are clustered together at 0.8850 and 0.8940 with the price stuck between them.

Can the price make it up through this overhead resistance? If it does, the next obstacle will be the downward yellow trendline around the 0.9000 area, and then some resistance areas up around 0.9100. Or, will the price break down through the ascending right triangle and break the lower resistance area? Or will it just go sideways? Who knows at this point, but the picture is getting clearer. At least now I know what questions to ask, and I can see a clear set of alternate scenarios happening.

Detective work. Let's look for more clues.

6. Check for pin bars or key reversal bars: I check the last bar in the daily, 3-hour and 30-min charts to see if one of these classic bar patterns shows up. There are none for AUD/USD.

7. Check for divergence. I've always liked the classical concept of divergence, and I just discovered the idea of hidden divergence as well. I use an 8 period RSI for this, and I check the daily, 3-hour and 30 minute charts. Here's what I found on the daily (note that my first buy order has triggered as I type this by the way ):

Name:  Divergence.JPG
Views: 4914
Size:  52.6 KB

There is both classical and hidden divergence here. The classical divergence is shown by the purple line on the RSI. We had a higher high on the price on November 6, but the RSI made a lower high instead. And we can see what happened after; big pullback to the main trend.

The hidden divergence has just happened is shown by the yellow line. Hidden divergence happens when the HH or LL is in the INDICATOR, not the price. But the rules are the same; HH ==> down and LL ==> up.

We had a swing low in October at about 0.8750. RSI made a low. Then the price FAILED to make a lower low last Monday. The low of this pullback is at 0.8750 again. But there IS a lower low in the RSI. So the rule is that we fade this LL in the indicator. We're looking to see price rise.

This is what tipped my analysis in favor of the long side here. We have bullish hidden divergence. We have a double bottom. We have an ascending right triangle on the lower TF. We have a general uptrend in the long TF. The interest rate differential is positive. The news lately has favored this pair to the long side. Everything is lining up.

Just to check myself, I checked for classical and hidden divergence on the 30 min TF. I did not find any divergence there. I found two higher highs in price that were accompanied by higher highs in RSI, so nothing to freak me out on that score.

I'm going to end this post now as AUD/USD moves a bit into my favor. But this is the process I used to analyze this trade, and it feels pretty good to me. All I have to do is get faster at it so I can analyze all my pairs instead of just one!

Out here...
__________________
"To the fearless mind. To the inviolate truth."
-Ayn Rand
Reply With Quote
  #11  
Old Nov 19, 2007 10:24pm
capitalist88's Avatar
Math Geek in Training
 
Member Since Oct 2006
More than 10 Vouchers  757 Posts
Thumbs down Stopped out

Right, so my long AUD/USD trade was stopped out for a loss of 40 pips on 1/2 of a full position. I had placed my orders in a 3,2,1 unit scaling order, so the only fill I got was the first three units. The others didn't fill and I cancelled them.

Bleh. I still think this is a good approach for long term trades though, so I'll continue to run through a detailed analysis of other pairs and see how it goes. I've got to remember that the potential gain from hitting a good trend while continually scaling in is HUGE, so I'll struggle through the ups and downs on the other trades.

On a lighter note, I was doing analysis on some other pairs last night and decided to look at the 5-second charts on some of them. While most of these extremely short term charts are very choppy, the EUR/JPY has a nice tight movement to it. So I watched it for a while and actually grabbed a quick 5 pips when I saw it accelerating into a downtrend.

So then I remembered that I was going to start looking for an intraday strategy this week to "fill the gaps" between my longer-term trades, and started to look around FF for such strategies. I've always seen this stuff about the "rainbow" which involves putting a bunch of moving averages on the chart and watching it move. I haven't been able to find a clear explanation of what constitutes a signal on this method though except that when the MAs spread out it indicates a strong trend.

Well, I threw a bunch of WMAs on the EUR/JPY chart with a nice little color scheme and watched it go. I managed to do two more trades, winning 4 pips each. Each of these trades took less than 2 minutes. I tried a couple tonight too, but lost 7 pips then 1 pip.

I'll be exploring this scalping technique a little more.
__________________
"To the fearless mind. To the inviolate truth."
-Ayn Rand
Reply With Quote
  #12  
Old Nov 24, 2007 4:40pm
capitalist88's Avatar
Math Geek in Training
 
Member Since Oct 2006
More than 10 Vouchers  757 Posts
Lightbulb Trading Timeframes and Schedule

Hello again,

Well I lost 3% of my account value this week, most of which is actually in open positions. I went short the USD against four other currencies on Thursday, so of course there was a little dollar rally on Friday. Bleh. Anyway, here's what the account looks like at the moment:

Name:  account.JPG
Views: 4793
Size:  33.0 KB

Ok, now to update where I am in getting my trading process organized. I'm still kind of bouncing around in "method-space" but things are getting clearer so it's not exactly aimless bouncing at this point.

First of all I came to a decision on timeframes, and this solves the whole "what does a trading session look like for me?" question. I am now a card carrying timeframe extremist; I'm comfortable with long TFs like daily or weekly charts. I'm also comfortable with very short TF charts like 1-min or 5-sec. What I can't stand are the ones in the middle. 30-min charts, 1-hour charts, or anything else in the middle like that is just not my thing.

Jumpin' cues and makin' haste just ain't my cup-o-meat... err, sorry. Quinn the Eskimo by Bob Dylan / Manfred Mann going through my head there.

One reason that I don't like the middle TFs is that I can't figure out how to limit the time for each trading session with bars of that length. If I'm waiting for a setup or signal on some hourly chart, I have to hang out for an hour waiting for a bar to finish. Then if that bar turns out to be an inside bar or something else that adds nothing to my picture of the price action, then I have to wait at least ANOTHER hour for something to happen. This could go on indefinitely. Another reason is that it's easy to miss setups or signals between sessions. If I have a trade based on hourly bars, it may last several days. But I miss 8 or 10 bars each day when I'm away from my trading station. So middle TF bars are just maddening to me.

On the very short or very long extremes of the TF spectrum both of these problems are solved. Working with daily bars means I can check a pair once a day for a few minutes, see what the last bar did, make whatever decisions/adjustments I have to, and then go away until the next day. I don't miss any bars, and I don't have to wait around for a bar to finish. On the other end of the spectrum, scalping in the 1-minute or less charts means that I can complete an entire trade in less than one trading session, or even in just a few minutes. Again, I don't have to wait around for hours to see what develops in price action; it's happening before my eyes. And I don't miss any bars in an open trade, because every trade is opened and closed within the span of a single session.

So now I have a good grasp on how to manage my trading routine and what a trading session "looks like" for me. Right now, I'm looking at 10 trading windows each week; the five 7-hour overlaps between Sydney and Tokyo from Sunday night to Thursday night and the five 4-hour overlaps between London and New York from Monday morning to Friday morning. This is a total of 55 hours, but I won't be trading that much. A session during one of these windows may actually take only an hour or two. So my weekly trading schedule will consist of a "pick your pocket Sunday (PYPS) night session, a morning and night session on Monday through Thursday, and a Friday morning session. I'm burning through savings right now so I may have to get another bill-paying job soon, but even in that case I would be able to trade at least half of these weekly sessions.

A session will basically consist of two parts; managing my long-term trades on the daily charts and then a period of scalping. So I will be running two very different but complimentary trading strategies and I've been working on the details of those. More detail to follow on each.
__________________
"To the fearless mind. To the inviolate truth."
-Ayn Rand
Reply With Quote
  #13  
Old Nov 24, 2007 6:40pm
Tiki Trader's Avatar
TT5 Trade towards the 5 ema
 
Member Since May 2006
Default Questions

OK, I have a couple of questions... I did not read so in depth everything written here so far... BUT... why do you have to try and get in at the very beginning of a trend ??? It is said... "bottom seekers will be cotton pickers" or something like that... why not get in on an already established trend...

Also, I question somewhat the MA's you are using, and if nothing else they were not in the right order on your first posted chart to suggest the start of a trend...

How about these MA's 5-13-62 EMAs

Or, 62, and 200 ema with the 800 SMA ( which you cannot get on oanda, but you can on MT4...

I have finally been convinced a while back that MA crossoever systems don't work too well... Price action does...

And well, sorry if I have stuck my nose in here, and probably proved to you that I have not really read every word written here... but, oh well...
__________________
Tiki Trader Trade Alerts... Inquire Within
Reply With Quote
  #14  
Old Nov 24, 2007 10:29pm
capitalist88's Avatar
Math Geek in Training
 
Member Since Oct 2006
More than 10 Vouchers  757 Posts
Question Huh?

Quote:
Originally Posted by Tiki Trader View Post
OK, I have a couple of questions... I did not read so in depth everything written here so far... BUT... why do you have to try and get in at the very beginning of a trend ??? It is said... "bottom seekers will be cotton pickers" or something like that... why not get in on an already established trend...

Also, I question somewhat the MA's you are using, and if nothing else they were not in the right order on your first posted chart to suggest the start of a trend...

How about these MA's 5-13-62 EMAs

Or, 62, and 200 ema with the 800 SMA ( which you cannot get on oanda, but you can on MT4...

I have finally been convinced a while back that MA crossoever systems don't work too well... Price action does...

And well, sorry if I have stuck my nose in here, and probably proved to you that I have not really read every word written here... but, oh well...

:surprised LOL, at first I thought you must have been reading someone else's journal and posting here by mistake. Then I figured out that you must be referring to post #3. You DO realize that the first two lines of post #3 are meant as a joke right? It's me having a conversation with the market. Nothing to do with the chart in the post. No one's trying to find the beginning of a trend. That was the point of the joke.

I guess I better work on my delivery a little more. I'll be appearing here every night this week folks! And don't forget to tip your waiters and waitresses...
__________________
"To the fearless mind. To the inviolate truth."
-Ayn Rand
Reply With Quote
  #15  
Old Nov 25, 2007 11:22pm
Saying 'No' to losses
 
Member Since Nov 2007
1 Vouchers  182 Posts
Default

Hi Cap'
great thread so far, keep up the good work.

<edit> Sorry, I'll leave it though, I should've checked your profile first
OT for a sec - Are you in Australia? If so do you find Oanda ok to deal with (if you're from Aus' you would know about the 'only deal with accredited co.'s etc). I am not a 'live' trader yet but have been studying stocks for a few years and now I found forex and that I 'cut my teeth' for a small amount of money I'm keen to get going very soon to test the water, from what I've read here so far Oanda seem ok.

Ok, back to the topic at hand. I too have been studying the effects of scaling into positions with various (but promising) results and I'm really starting to think this is the 'clue' to being profitable in the markets (particularly forex!). Put it this way, I've pretty well abandoned all TA's apart from perhaps an MA for longer term trends in smaller time frames (saves me zooming in and out all the time ) so I guess I would be a discretionary trader using price action to make my entry/exit decisions.
I have a few ideas on scaling in but basically I will be using 'classical' set ups such as the 1-2-3, pennants/flags et al to keep things real simple, the only strict parameters I will be sticking too will be to really maximise the wins and minimise the losses. That is, I'll let the market come to me for entry setting buy/sell stops at what I would like to think is a break out/confirmation then as price goes in my favour keep scaling in, if it fails to go my way after entry or looks like it's going to fail with conviction I'll get out for a small profit or break there abouts - that's the theory anyway
The only part to work out is the scaling in and TP but I think I'll leave my original stops until I have at least 2-3 units locked in and then trail the stop at a reasonable level behind to avoid short term shake outs but allows me to lock in profits if taken out as the compounding even after 3 units is a lot better than an outright entry with one unit and I'm risking less at the outset.

Anyway, keep us posted and good luck. I'll let you know how I get on but now I really do believe that entry and TA is not that important and what the pro's have been telling us all along is that it is money management (not just risk!) is more important to make good money in this game.

Cheers,
Mick.

Last edited by MickD, Nov 25, 2007 11:46pm
Reply With Quote
Reply

1 Trader Viewing This Thread (0 are members)
 
Thread Tools Search this Thread
Search this Thread:

Advanced Search


Similar Threads
Thread Thread Starter Forum Replies Last Post
Murray Math rdoc45 Trading Discussion 10 Jun 3, 2009 9:37pm
I'm no good at Math, please help me here. Zen_Leow Rookie Discussion 9 Dec 28, 2008 7:03am
help me do a math: what is Margin Call? neo007 Rookie Discussion 0 Mar 22, 2008 7:26am
Checking my math Marrethiel Rookie Discussion 1 Sep 3, 2007 9:00am
Math question. . Enderknight17 Rookie Discussion 6 Dec 12, 2006 8:13am