Hi all I need some help fixing this dashboard indicator
My objective is to display mainly for the 4H the indexes that are in the best configuration
either in UP trend and below Stoch 20 and Down trend and above Stoch 80.
the dashboard was created to display some occurrences of conditions in all the time frames at one view shot.
I use it and change the conditions to what I want to display.
This time I want to display the pairs or indexes that are either in an up/down trend according to Bob's rules ( 60 over 240 MA - UP) (60 below 240 MA - DOWN)
When i use only those MA conditions The display look OK .
I want to add an extra condition which is
UP & Stoch below 20 - display a green symbol
DOWN & Stoch Above 80 - display a red symbol
As you can see on the picture the EURX was in an UP trend and Stoch above 80 and still I Got a green symbol showing, although it disappeared some time after the picture taken.
the lines of code involved are 320 ,330 , 364 - 370 as far as I know
Thanks for your help 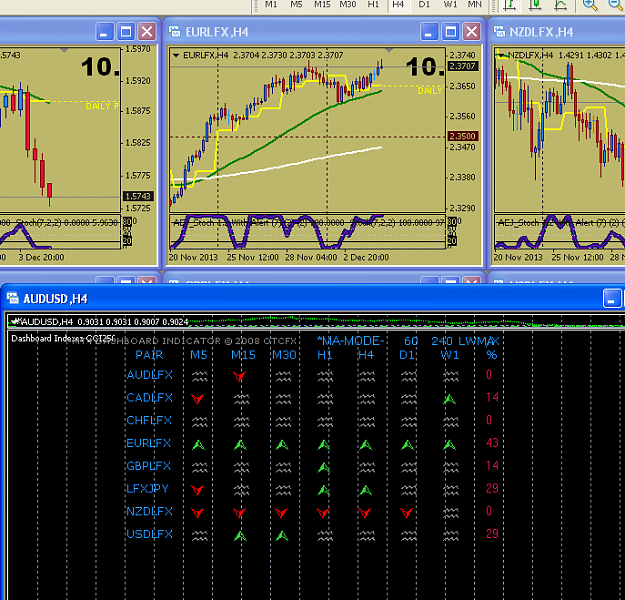
My objective is to display mainly for the 4H the indexes that are in the best configuration
either in UP trend and below Stoch 20 and Down trend and above Stoch 80.
the dashboard was created to display some occurrences of conditions in all the time frames at one view shot.
I use it and change the conditions to what I want to display.
This time I want to display the pairs or indexes that are either in an up/down trend according to Bob's rules ( 60 over 240 MA - UP) (60 below 240 MA - DOWN)
When i use only those MA conditions The display look OK .
I want to add an extra condition which is
UP & Stoch below 20 - display a green symbol
DOWN & Stoch Above 80 - display a red symbol
As you can see on the picture the EURX was in an UP trend and Stoch above 80 and still I Got a green symbol showing, although it disappeared some time after the picture taken.
the lines of code involved are 320 ,330 , 364 - 370 as far as I know
Thanks for your help
Attached File(s)
Attached Image (click to enlarge)