Forex Factory
  • Login

  • Username: Password:
  • 6:37pm

  • Search
  • Home

  • Forums

  • Trades

  • Calendar

  • News

  • Market

  • Brokers

Options

Search
Search
Search

Subscribe to Thread

Bookmark Thread

First Page First Unread Last Page Last Post

Printable Version

Similar Threads

Auslanco - GBP/JPY and GBP/USD (newstrade) 235564 replies

Auslanco 15min GBP/JPY startegy 630 replies

My MT4 indicators for Auslanco's strategy 92 replies

gbp/jpy Strength Indicator strategy Back Testing 88 replies

Auslanco 15 minute Strategy Oanda FXManager Updates.. 62 replies

  • Trading Systems
  • /
  • Reply to Thread
  • 64

Auslanco-GBP/JPY Strength Indicator strategy

  • Last Post
  • First Unread
  •  
  • Page 1 23456 18
  •  
  • Post# 1
  • Quote
  • First Post: Aug 5, 2007 10:22am | Edited at 10:56pm
  • auslanco
    Joined Feb 2007 | 6,627 Posts | Status: Trade @ your own risk
Hi guys...I'm trying to put up the much needed strategy rules for my system.


Lesson-1
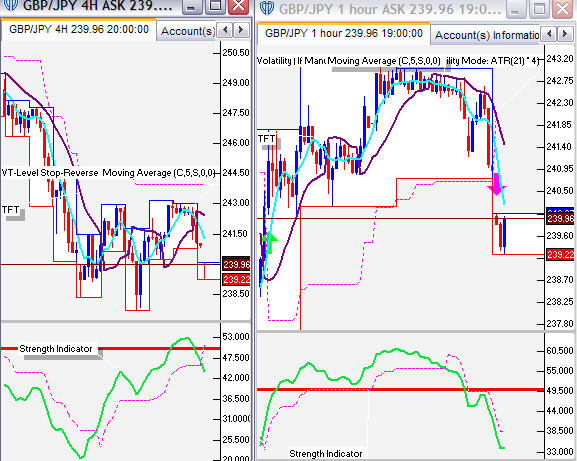
First I will introduce you to the two main indicators I use for my trading. It's safe to place trades just by using these two indicators after you confirm a trade according to the strategy rules.

a. The strength Indicator
b. TFT line

For VT Trader users:

S
trength Indicator = Quantitative Qualitative Estimation Indicator ( Smoothing period 5) Please go to indicator properties and add a red line on the value 50.
Go to color /style on the same indicator properties and turn the LevelRSIfast to white(invisible)....

TFT = Gann HiLo Activator (period/value 10)


Free charting package VT trader- freewww.vtsystems.com

Time frames 4hr,1hr

Check list before enter a trade:

Buy signal
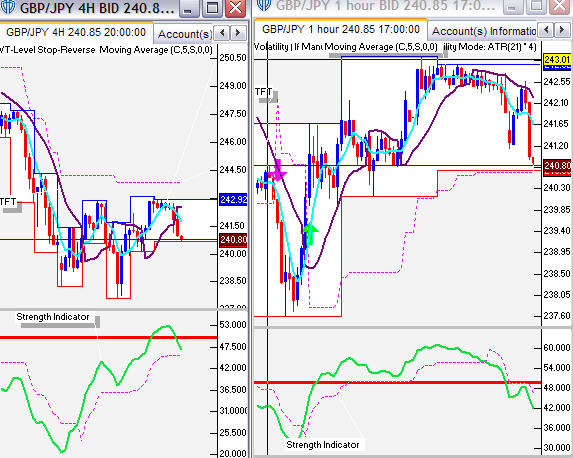
A).4hr chart:First confirm the 4hr Strength indicator has turned bullish( This can be either below or above the 50 line) Please note that the 4hr strength indicator doesn't have to cross over to the 50 line.

B).4hr chart:Make sure the candle has formed above the TFT line.

now once you confirm the above two features you know the short-medium term trend is bullish.

Entry:

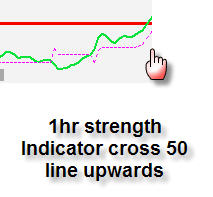
C). 1hr charts: you only enter @ the point of the strength indicator cross over the 50 line upwards.

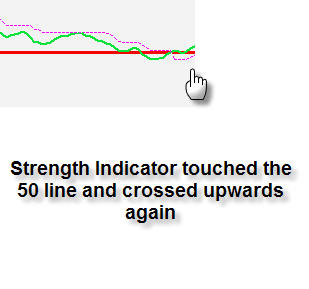
If you find that 1hr SI is way above the 50 line by the time you get a cross over confirmation from 4hr, that means a major retracement is due. please wait untill the 1hr SI turn bearish and go back to bullish again to enter.

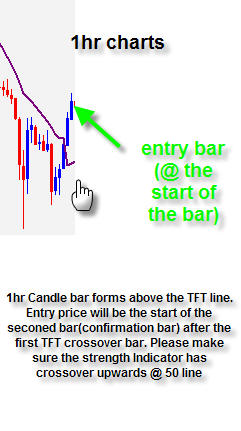
d). 1hr Charts: Make sure a candle has formed above the TFT line.

Always enter @ the start of 1hr confirmation bar(second bar after the TFT crossover bar )
Attached Image
  • Post# 2
  • Quote
  • Aug 5, 2007 10:24am
  • auslanco
    Joined Feb 2007 | 6,627 Posts | Status: Trade @ your own risk
1hr charts entry confimation
Attached Image
  • Post# 3
  • Quote
  • Aug 5, 2007 10:25am
  • auslanco
    Joined Feb 2007 | 6,627 Posts | Status: Trade @ your own risk
1hr strength indicator crossover entry point for 200 pips
Attached Image
  • Post# 4
  • Quote
  • Aug 5, 2007 10:29am | Edited at 11:24am
  • auslanco
    Joined Feb 2007 | 6,627 Posts | Status: Trade @ your own risk
1hr strength indicator cross example: another buy signal 200 pips
Attached Image
  • Post# 5
  • Quote
  • Aug 5, 2007 10:32am | Edited at 11:25am
  • auslanco
    Joined Feb 2007 | 6,627 Posts | Status: Trade @ your own risk
Please note that the Sell signals are vise versa.

I will keep updating more graphics and examples in the near future.

Please practice these indicator behaviors on a demo account before you apply them on to your real money trading .
  • Post# 6
  • Quote
  • Aug 5, 2007 11:02am
  • auslanco
    Joined Feb 2007 | 6,627 Posts | Status: Trade @ your own risk
Current charts as of Sunday 5th August @ 2.53GMT (10.53EST)


4hr strength indicator still hasn't crossed down to bearish.
1 hr crossed down below the 50 line.
Both 1hr & 4hr price bars are below the TFT line

Interpretation: When I get my new chart updates on Monday Asian session I would expect the 4hr Strength Indicator to be crossed down. But the 1hr Strength indicator is way below the 50 line.My usual entry point is when the strength indicator cross @the 50 line on 1hr charts, providing that 4hr strength indicator has turned bearish already.. There for I will wait until the 1hr strength indicator cross upwards and cross downward again before I enter.. as there could be a retracemnt around to 241.40 area @ asian early to mid hours before it starts a bearish rally.
Attached Image
  • Post# 7
  • Quote
  • Aug 5, 2007 12:48pm
  • chuckeepw
    Joined May 2005 | 67 Posts | Status: Member
The link in post one to free vt systems does not work
  • Post# 8
  • Quote
  • Aug 5, 2007 12:58pm
  • auslanco
    Joined Feb 2007 | 6,627 Posts | Status: Trade @ your own risk
Quoting chuckeepw
The link in post one to free vt systems does not work
Just corrected it
  • Post# 9
  • Quote
  • Aug 5, 2007 3:39pm
  • brok
    Joined Aug 2006 | 399 Posts | Status: Member
Hi Auslanco,

Were you just using these indicators in the past days? No need for MACD, Momentum etc?
  • Post# 10
  • Quote
  • Aug 5, 2007 4:07pm
  • trader8686
    Infractions Overload | 1,265 Posts | Joined Feb 2007
Auslanco,

The vtsystem link you posted still don't work.
I am using the broker: www.cmsfx.com, and they are providing VT trader, too. Name sound the same, but I wnat to make sure that is the same VT you are using.
  • Post# 11
  • Quote
  • Aug 5, 2007 4:50pm
  • oztrader
    Joined Dec 2006 | 142 Posts | Status: Member
Aus

I am having trouble getting the link to work as well

Cheers
  • Post# 12
  • Quote
  • Aug 5, 2007 5:47pm
  • Qpip
    Joined Jul 2007 | 986 Posts | Status: Member
Quoting oztrader
Aus

I am having trouble getting the link to work as well

Cheers
http://tinyurl.com/363r9m
  • Post# 13
  • Quote
  • Aug 5, 2007 6:49pm
  • auslanco
    Joined Feb 2007 | 6,627 Posts | Status: Trade @ your own risk
4Hr Strength Indicator: crossed down (but the confirmation bar has not yet formed -next bar)
4Hr TFT: price is below the TFT line
1Hr Strength Indicator: Crossed down but way below the 50 line
1Hr TFT: the new bar is Way below the TFT line

Interpretation: Since the 1Hr S.I is way below the 50 line(my entry point is @ the 50 line crossing) I will wait until the 1hr SI cross upwards(retracement) and as it crosses back down again I may go short(if the 4hr SI is still crossed down).

We will have an awesome short(Sell) day today with a guaranteed 300 pips since the daily momentum and trend is extremely bearish.
Attached Image
  • Post# 14
  • Quote
  • Aug 5, 2007 6:51pm
  • auslanco
    Joined Feb 2007 | 6,627 Posts | Status: Trade @ your own risk
Quoting brok
Hi Auslanco,

Were you just using these indicators in the past days? No need for MACD, Momentum etc?
Hi brok.. No need of any extra indicators..Once you master these two indicators , You can use the other indicators (Stoch, Momentum etc etc ) just to confirm what you see. But S.I and TFT are the main two indicators
  • Post# 15
  • Quote
  • Aug 5, 2007 6:53pm
  • auslanco
    Joined Feb 2007 | 6,627 Posts | Status: Trade @ your own risk
Here's the link again Guys, (for the free VT trader charting platform )


www.vtsystems.com
or

www.cmsfx.com
  • Post# 16
  • Quote
  • Aug 5, 2007 7:17pm
  • auslanco
    Joined Feb 2007 | 6,627 Posts | Status: Trade @ your own risk
Quoting trader8686
Ausi,

I found the VT trader.
All indicators you are using are built in on VT trader, right?
Yess,, they are all built in (free) with VT
  • Post# 17
  • Quote
  • Aug 5, 2007 7:30pm
  • auslanco
    Joined Feb 2007 | 6,627 Posts | Status: Trade @ your own risk
Here's a great source to learn about candlestick patterns if you are interested

http://www.actionforex.com/articles_..._200605107114/
  • Post# 18
  • Quote
  • Aug 5, 2007 7:43pm | Edited at 7:58pm
  • mktjong
    Joined Nov 2006 | 5,013 Posts | Status: Trader
Quoting auslanco
4Hr Strength Indicator: crossed down (but the confirmation bar has not yet formed -next bar)
4Hr TFT: price is below the TFT line
1Hr Strength Indicator: Crossed down but way below the 50 line
1Hr TFT: the new bar is Way below the TFT line

Interpretation: Since the 1Hr S.I is way below the 50 line(my entry point is @ the 50 line crossing) I will wait until the 1hr SI cross upwards(retracement) and as it crosses back down again I may go short(if the 4hr SI is still crossed down).

We will have an awesome short(Sell) day today with a guaranteed 300 pips since the daily momentum and trend is extremely bearish.
Dear Auslanco,

I downloaded VT Navigator trading station, but I don't see "Strength Indicator". Where do you get that?

Thanks, Michael
  • Post# 19
  • Quote
  • Aug 5, 2007 7:45pm | Edited at 10:57pm
  • auslanco
    Joined Feb 2007 | 6,627 Posts | Status: Trade @ your own risk
Quoting mktjong
Dear Auslanc0,

I downloaded VT Navigator trading station, but I don't see "Strength Indicator". Where do you get that?

Thanks, Michael

Please read the very first post: it's called QQE
  • Post# 20
  • Quote
  • Aug 5, 2007 7:58pm
  • mktjong
    Joined Nov 2006 | 5,013 Posts | Status: Trader
Quoting auslanco
Please read the very first post: it's called QQI
Ok, got it. Thanks
Thread Tools Search this Thread
Show Printable Version Show Printable Version
Email This Thread Email This Thread
Search this Thread:

Advanced Search

  • Trading Systems
  • /
  • Auslanco-GBP/JPY Strength Indicator strategy
  • Reply to Thread
    • Page 1 23456 18
0 traders viewing now
  • More

©2013 Forex Factory, Inc. / Terms of Use / Privacy Policy

Forex Factory® is a registered trademark.

Connect

  • Facebook
  • Twitter
  • RSS

Company

  • About FF
  • FF Blog
  • Careers at FF
  • Advertising
  • Contact FF

Products

  • Forums
  • Trades
  • Calendar
  • News
  • Market
  • Brokers
  • Trade Explorer

Website

  • Homepage
  • Search
  • User Guide
  • Member List
  • Online Now
  • Report a Bug