Forex Factory
  • Login

  • Username: Password:
  • 7:01am

  • Search
  • Home

  • Forums

  • Trades

  • Calendar

  • News

  • Market

  • Brokers

Options

Search
Search
Search

Subscribe to Thread

Bookmark Thread

First Page First Unread Last Page Last Post

Printable Version

  • Interactive Trading
  • /
  • Reply to Thread
  • 2,141

Elliott wave outlook

  • Last Post
  • First Unread
  •  
  • Page 1 23456 433
  •  
  • Linked Explorer: LEO | Demo Account XXXX55
  • Guide
  • Options
  • Expand
  • Retract
  • Sync
  • Last Sync: 33 hr ago
  • Overview

  • Trade Report

  • Trade Graph

  • Trade List

  • Period: All History

  • Trader:
  • Broker:
  • Type:
  • Balance:
  • Unrealized:
  • Equity:
  • Luis Carlos
  • OANDA
  • Demo
  • $252,613
  • -$81,957
  • $170,656
Performance   Return   Profit   Pips   Entr/Exit   Lots  
Today (Sun) ? ? ? ? ?  
This Week -0.1% -$243 -104 0/0 3
This Month 6.0% $9,612 -410 0/1 7
This Year 40.8% $49,705 -825 11/13 34.00033
All Time 71.6% $71,703 -1,782 51/49 76.50033
Open Trades   MTM   Lots   Lev   Return   Profit   Pips   Target (Gap)  
EUR/JPY Sell 105.79 132.59 1 1:1 -10.3% -$25,957 -2,680 117.50 (1509)  
EUR/JPY Sell 103.68 132.59 2 2:1 -22.2% -$56,000 -2,891 117.50 (1509)  
Totals:       3   2:1   -32.4%   -$81,957   -5,571     
Return by Trade#
51 Trades
Profit by Weeks
39 Weeks
Non-Cume Return
51 Trades
Equity Balance
39 Weeks
  • All History
  • Today
  • Yesterday
  • This Week
  • This Month
  • This Year
  • Last Week
  • Last Month
  • Last Year
to
No trading activity in this period.
  • Opened Jun 20, 2012 | Never Closes | 182 Votes
  • Poll Results
What will be the EUR/USD low? Show Voters
Above 1.20 66 Votes 36.26%
(1.1801-1.2000) 29 Votes 15.93%
(1.1601-1.1800) 16 Votes 8.79%
(1.1401-1.1600) 12 Votes 6.59%
(1.1201-1.1400) 17 Votes 9.34%
(1.1001-1.1200) 11 Votes 6.04%
Below 1.10 31 Votes 17.03%
  • Post# 1
  • Quote
  • First Post: Jun 20, 2012 10:51pm | Edited Oct 18, 2012 12:17pm
  • Luis Carlos
    Joined Jun 2009 | 4,925 Posts | Status: Member
Hi Everybody,

1. This thread is for people that use or want to use Elliott Wave (EW) as a tool to improve his/her trading.

2. This thread is for people that want to work as a team to make money.

The idea is to share different points of view and technics, not only EW, to reach a consensus.

3. This thread is for people that think to know about EW and dont know that it is a psyco tool.

A lot of "master of trading" or "people that never lose a call" like to talk about EW as a trash. That is because dont know anything about it.

4. This thread is not for MORONS, people that think "they are the last glass of water in the desert"

5. Here we going to talk about key fundamentals, no everyday noise fundamentals


Good Luck!


Elliott Wave Theory

Ralph Nelson Elliott developed the Elliott Wave Theory in the late 1920s by discovering that stock markets, thought to behave in a somewhat chaotic manner, in fact traded in repetitive cycles.

Elliott discovered that these market cycles resulted from investors' reactions to outside influences, or predominant psychology of the masses at the time. He found that the upward and downward swings of the mass psychology always showed up in the same repetitive patterns, which were then divided further into patterns he termed "waves".

Elliott's theory is somewhat based on the Dow theory in that stock prices move in waves. Because of the "fractal" nature of markets, however, Elliott was able to break down and analyze them in much greater detail. Fractals are mathematical structures, which on an ever-smaller scale infinitely repeat themselves. Elliott discovered stock-trading patterns were structured in the same way.

Market Predictions Based on Wave Patterns
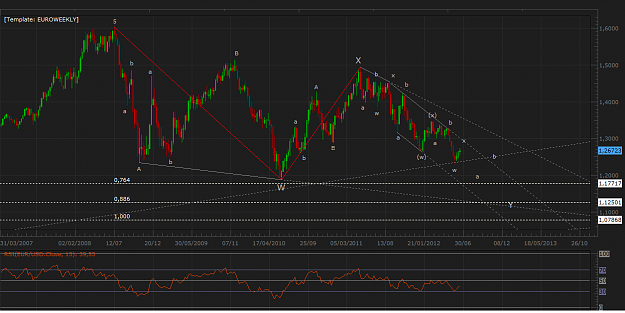
Elliott made detailed stock market predictions based on unique characteristics he discovered in the wave patterns. An impulsive wave, which goes with the main trend, always shows five waves in its pattern. On a smaller scale, within each of the impulsive waves, five waves can again be found. In this smaller pattern, the same pattern repeats itself ad infinitum. These ever-smaller patterns are labeled as different wave degrees in the Elliott Wave Principle. Only much later were fractals recognized by scientists.


In the financial markets we know that "every action creates an equal and opposite reaction" as a price movement up or down must be followed by a contrary movement. Price action is divided into trends and corrections or sideways movements. Trends show the main direction of prices while corrections move against the trend. Elliott labeled these "impulsive" and "corrective" waves.


Read more: http://www.investopedia.com/articles...#ixzz1yOSMdHBB


BOOKS OF INTEREST

THE ELLIOTT WAVE PRINCIPLE by Frost

'Technical Analysis of The Financial Market " By John J Murphy
Stocktwit: LuisCarlos - twitter: @lcparodi
  • Post# 2
  • Quote
  • Jun 20, 2012 11:00pm
  • RMiranda
    Joined Feb 2011 | 41 Posts | Status: Trading from Costa Rica
Hello Carlos, congrats for your own thread! I just started reading Neo EW so im looking forward to see real time examples (not the ones in the book). I am subscribing to this thread. Exitos!!
  • Post# 3
  • Quote
  • Jun 20, 2012 11:46pm
  • Luis Carlos
    Joined Jun 2009 | 4,925 Posts | Status: Member
Quoting RMiranda
Hello Carlos, congrats for your own thread! I just started reading Neo EW so im looking forward to see real time examples (not the ones in the book). I am subscribing to this thread. Exitos!!
Por favor Roberto borra el comentario que me faltaron poner mas fotos. Gracias
Stocktwit: LuisCarlos - twitter: @lcparodi
  • Post# 4
  • Quote
  • Jun 20, 2012 11:48pm
  • Luis Carlos
    Joined Jun 2009 | 4,925 Posts | Status: Member
Theory Interpretation
Attached Images (click to enlarge)
Click to Enlarge

Name: P8.png
Size: 21 KB Click to Enlarge

Name: P9.png
Size: 27 KB Click to Enlarge

Name: P10.png
Size: 54 KB
Stocktwit: LuisCarlos - twitter: @lcparodi
  • Post# 5
  • Quote
  • Jun 20, 2012 11:50pm
  • BFSGcapital
    Commercial Member | 1,114 Posts | Joined Apr 2012
It's about time you made this thread!

Thanks and will be a regular reader for sure

Let me know if you need me to delete this post..
An opportunity lost is not a capital cost.
  • Post# 6
  • Quote
  • Jun 21, 2012 12:02am
  • Luis Carlos
    Joined Jun 2009 | 4,925 Posts | Status: Member
Quoting BFSGcapital
It's about time you made this thread!

Thanks and will be a regular reader for sure

Let me know if you need me to delete this post..
Thank you man! Dont worry I need just the two above.
Stocktwit: LuisCarlos - twitter: @lcparodi
  • Post# 7
  • Quote
  • Jun 21, 2012 12:03am
  • balanced2012
    Joined May 2012 | 340 Posts | Status: Learner !!!
Quoting Luis Carlos
Theory Interpretation

Congratulations Carlos

Please keep the good posts which been educating many of new traders and me one of them .... good luck and all the best !!
“Don't cry because it's over, smile because it happened.”
  • Post# 8
  • Quote
  • Jun 21, 2012 12:10am
  • Luis Carlos
    Joined Jun 2009 | 4,925 Posts | Status: Member
Quoting balanced2012
Congratulations Carlos

Please keep the good posts which been educating many of new traders and me one of them .... good luck and all the best !!
Thank very much. I will try to the best.
Stocktwit: LuisCarlos - twitter: @lcparodi
  • Post# 9
  • Quote
  • Jun 21, 2012 12:20am
  • Luis Carlos
    Joined Jun 2009 | 4,925 Posts | Status: Member
This is my weekly timeframe count. I try to do the best using the rules.

You must find out thousands of different counts of this pair and that is because the count depends of the view or interpretation that who is doing it.

You can see some targets for EUR/USD low, which ones could be differents in lowers timeframes.
Attached Image (click to enlarge)
Click to Enlarge

Name: 20.06.12.png
Size: 56 KB
Stocktwit: LuisCarlos - twitter: @lcparodi
  • Post# 10
  • Quote
  • Jun 21, 2012 12:47am | Edited at 1:03am
  • Luis Carlos
    Joined Jun 2009 | 4,925 Posts | Status: Member
Here is another example.

Looking for a ABC correction uses a fib expantion and we can find some targets for the next years. That is good to know because if you are a buyer and you are in those levels next years, the risk is too high to buy because we expect a swing down.

Also look at that could have FLAT correction. Using fib expantion we try to look at the equal wave as a target, that is 70.68 as a correction ending, but could be other targets like 1.272 or 1.618 fib levels or a good support. So you cant buy there before look a confirmation that the cycle is over.
Attached Image (click to enlarge)
Click to Enlarge

Name: oil.png
Size: 48 KB
Stocktwit: LuisCarlos - twitter: @lcparodi
  • Post# 11
  • Quote
  • Jun 21, 2012 1:01am
  • Luis Carlos
    Joined Jun 2009 | 4,925 Posts | Status: Member
I posted this early when I saw the possibility of a new high, but when the market overlap the wave 1 I confirmed no more highs before get more lower.

The line in the chart has no measure.

To confirm the resume of bears, with this count we need to break 1.2555

Good Nite!!!
Attached Image (click to enlarge)
Click to Enlarge

Name: eu15min20.PNG
Size: 71 KB
Stocktwit: LuisCarlos - twitter: @lcparodi
  • Post# 12
  • Quote
  • Jun 21, 2012 3:21am
  • polatok
    Joined Jan 2012 | 453 Posts | Status: Trend is Friend
Congratulations luis for this thread. this will be a great place for the ew traders.

Good luck.
Take what you can take give nothing back!
  • Post# 13
  • Quote
  • Jun 21, 2012 8:42am
  • Luis Carlos
    Joined Jun 2009 | 4,925 Posts | Status: Member
This is a near term outlook. Everybody knows that is it hard to count corrections, but this could be happening right now.

1. Yellow: we finish 2 and then go higher
2. White: break 1.2657 and finish the correction @(1.26-1.2630)
3. Break 1.2555 confirm bears.

Attached Image (click to enlarge)
Click to Enlarge

Name: eu.15min.png
Size: 58 KB
Stocktwit: LuisCarlos - twitter: @lcparodi
  • Post# 14
  • Quote
  • Jun 21, 2012 12:07pm
  • Luis Carlos
    Joined Jun 2009 | 4,925 Posts | Status: Member
The white count doesnt gonna make it. So we need to be prepare with the yellow one.
Attached Image (click to enlarge)
Click to Enlarge

Name: eu.15min2.png
Size: 63 KB
Stocktwit: LuisCarlos - twitter: @lcparodi
  • Post# 15
  • Quote
  • Jun 21, 2012 12:18pm
  • Luis Carlos
    Joined Jun 2009 | 4,925 Posts | Status: Member
I will tell you how I use paths in EW. For example: Yesterday I had to path remaining and both should go down, but could return. So If both should go down then I shorted at 1.2703 a nice lot after US market. Then when the market was 1.2670 I put a stop at 1.2700 to protect me of the possible come back. What happened? I stopped out at 1.27003 and I missed all the profits.

What was my mistake, my mistake was put the stop thinking in 1.27 because is a round number, and not good technical price. At least I have a small short in aussie.

We still have good opportunities un EU to get short in the wave 2
Stocktwit: LuisCarlos - twitter: @lcparodi
  • Post# 16
  • Quote
  • Jun 21, 2012 12:46pm | Edited at 1:42pm
  • Luis Carlos
    Joined Jun 2009 | 4,925 Posts | Status: Member
Until now I dont anything more. Wave 3 is near to finish or is done (if there is not more extensions).

The 1h chart is done. Now we need to watch this down trend to determinate if this is definitive or is just a ABC correction of big yellow (A)
Attached Images (click to enlarge)
Click to Enlarge

Name: eu.15min3.png
Size: 62 KB Click to Enlarge

Name: eu.1h.png
Size: 57 KB
Stocktwit: LuisCarlos - twitter: @lcparodi
  • Post# 17
  • Quote
  • Jun 21, 2012 12:50pm
  • polatok
    Joined Jan 2012 | 453 Posts | Status: Trend is Friend
Luis, form where is the Big a coming now ? i don't see any 12345 complete yet. we are at wave 4 right ?
Take what you can take give nothing back!
  • Post# 18
  • Quote
  • Jun 21, 2012 12:55pm
  • Luis Carlos
    Joined Jun 2009 | 4,925 Posts | Status: Member
Quoting polatok
Luis, form where is the Big a coming now ? i don't see any 12345 complete yet. we are at wave 4 right ?
Yes, could be if we reach @ 1.2585 if wave 4
Stocktwit: LuisCarlos - twitter: @lcparodi
  • Post# 19
  • Quote
  • Jun 21, 2012 1:03pm
  • Luis Carlos
    Joined Jun 2009 | 4,925 Posts | Status: Member
If somebody has another view should be good to know!
Stocktwit: LuisCarlos - twitter: @lcparodi
  • Post# 20
  • Quote
  • Jun 21, 2012 1:05pm
  • polatok
    Joined Jan 2012 | 453 Posts | Status: Trend is Friend
I am counting abc only with channel and fib.
Attached Image (click to enlarge)
Click to Enlarge

Name: eur usd 4h.gif
Size: 20 KB
Take what you can take give nothing back!
Thread Tools Search this Thread
Show Printable Version Show Printable Version
Email This Thread Email This Thread
Search this Thread:

Advanced Search

  • Interactive Trading
  • /
  • Elliott wave outlook
  • Reply to Thread
    • Page 1 23456 433
1 trader viewing now
  • More

©2013 Forex Factory, Inc. / Terms of Use / Privacy Policy

Forex Factory® is a registered trademark.

Connect

  • Facebook
  • Twitter
  • RSS

Company

  • About FF
  • FF Blog
  • Careers at FF
  • Advertising
  • Contact FF

Products

  • Forums
  • Trades
  • Calendar
  • News
  • Market
  • Brokers
  • Trade Explorer

Website

  • Homepage
  • Search
  • User Guide
  • Member List
  • Online Now
  • Report a Bug