Beyond the Candles
Presentation:
I'm a technical trader and this is not my method, it is a market's method. It is based on what we hear every day long:
-trade with the trade
-trade the retracements of the main trend.
This is long-live proved method and what I will explain here it is only what is works for me and the way it does !
The method.
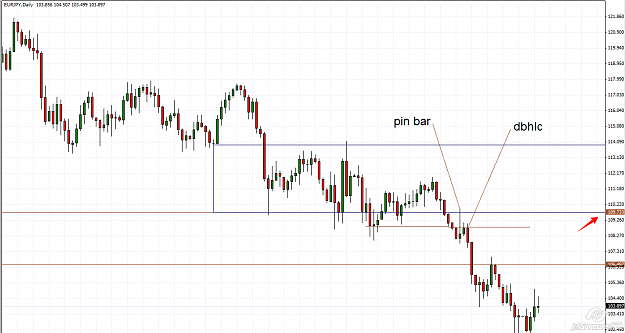
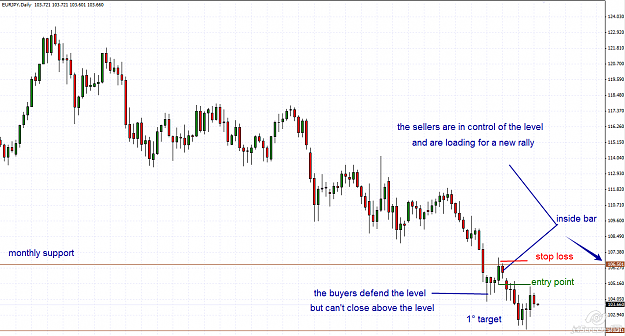
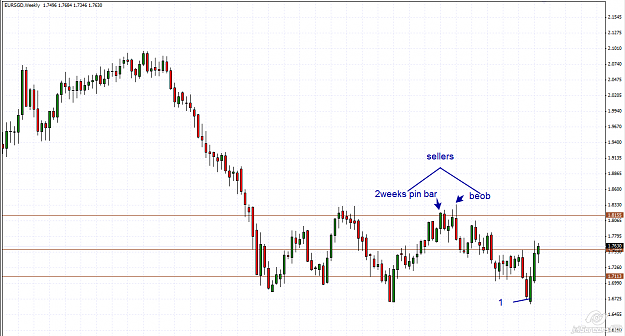
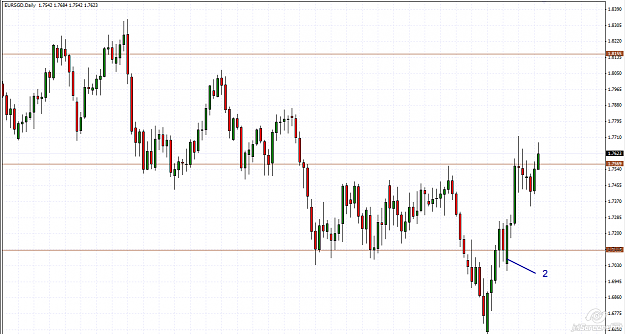
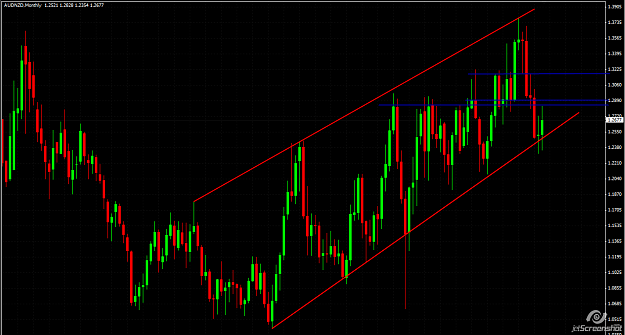
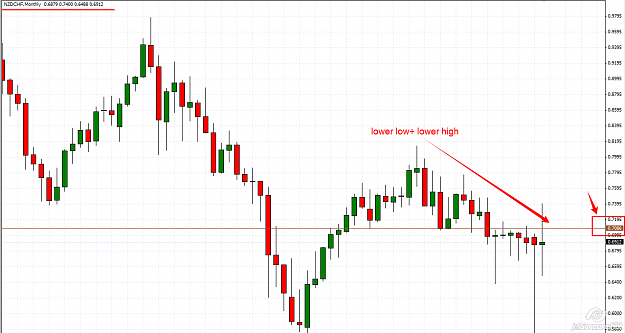
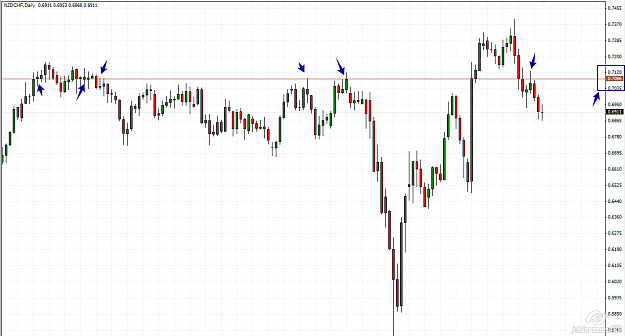
a-Identify if the price is trendy market(up/down) on monthly and weekly charts, wait for a retracement with price action confirmation and entry on daily chart (buy at resistance and sell at support level).
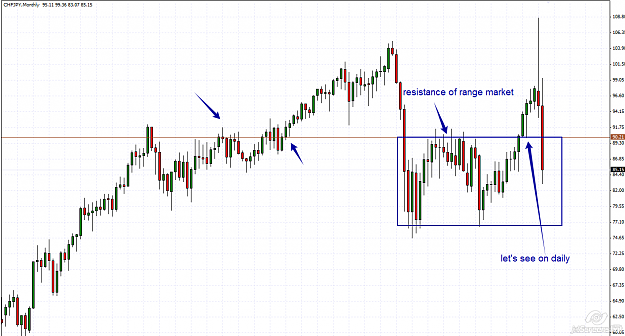
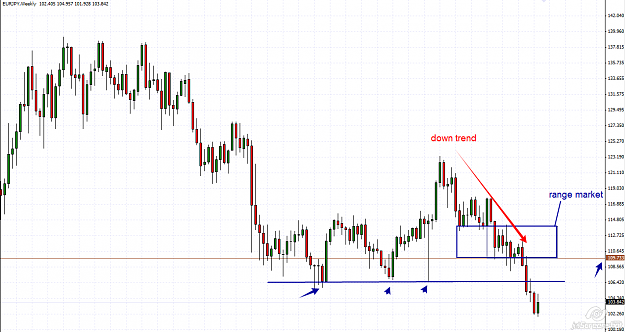
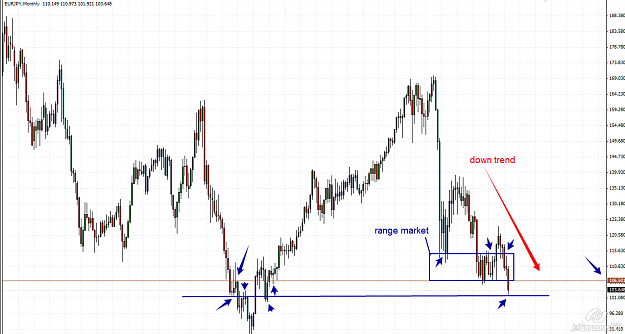
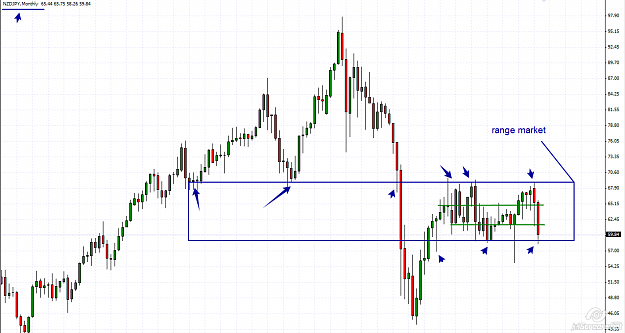
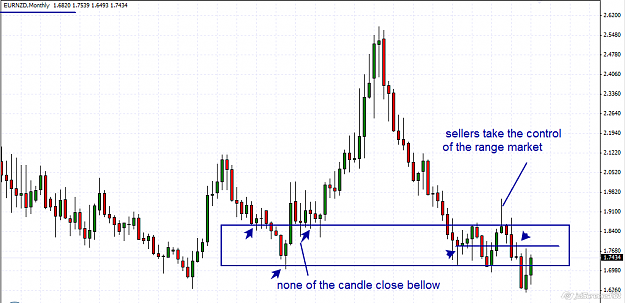
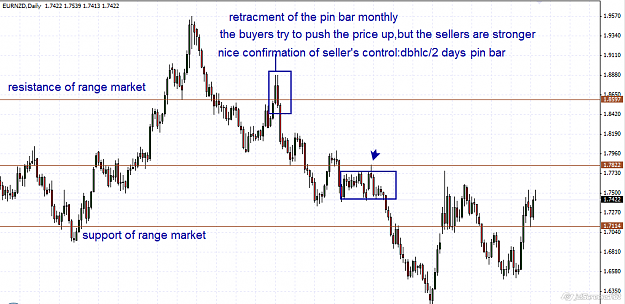
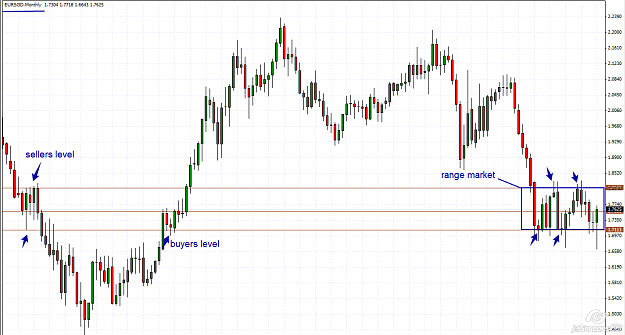
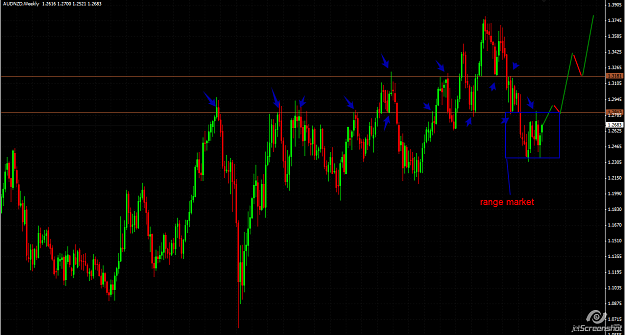
b-Identify if the price is consolidating on monthly and weekly charts, wait the price to reach the top (down trend) and the bottom (up trend) and trade the consolidation in the main trend direction on daily chart.
The trading process has few rules/steps:
The market study
-the process of identifying what the price is doing: trend or range market.
-the process of identifying the support/resistance levels.
Psychology
-plan the trade-one of the most important in trading process is the trade plan, understanding what the price is doing, who is in the market control, waiting for the price to reach our levels and the emotion control.
We accept and we are taking all the responsibility for our actions as trades, entries, exits, etc.
Trading decision
-the fase when we have the confirmation by who is in the market control. we have a trading decision only if the price does what we are expecting, for all the rest of market situation…we stay out.
Entry
-only with price action confirmation to the choosen levels
-only with pending orders
-only above/bellow the first daily support/resistance level
Stop loss
-above/bellow the current swing
-above/bellow the first daily support/resistance level
Money management
-could be very different in base of our market analyse: trend/range market
-money management in trendy market: a-stop loss moved behind the last daily swing; b-stop loss moved behind the last weekly candle; c-stop loss moved behind the choosen levels (with daily entries, we are looking for monthly and weekly levels+ confluences); d-partial taking profit.
-money management in range market: a-the stop loss at break even as soon as possible: b-quickly partial profits of the most important levels from the inside of consolidation.
Risk
-all of the trades don’t have to exceed 2-3% of account’s size.
-capital preservation.
Exit
-to the support/resistance levels
-to the reverse candle/patterns
Trade’s analyse
-after every trade, we analyse it in order to learn from our own experience the positive and negative aspects of our trades.
Tools
-price action candles
-support/resistance levels
-patterns
-confluences
-trend lines
-channels
-Big Round Numbers and Round Numbers
-Fibbonacci levels.
Thread rules
-respect
-friendly environment
-no time frame lower than daily
-I lost pips and precious time with “dreams”…so no EA, lagging lines, indicators, etc.
Just a simple, clean chart with proper attitude is the best way to start being profitable !
Disclaimer
-the purpose of this thread is trading education/ experience to high quality level
-every trader is responsible for his own actions.
Thank you
fxgroup.
Abbreviations used:
P-PRICE
WPD-WHAT THE PRICE IS DOING
WPG-WHERE THE PRICE IS GOING
BUOB-BULLISH OUTSIDE BAR
BEOB-BEARISH OUTSIDE BAR
PB-PIN BAR
DBLHC-DOUBLE BAR LOW HIGHER CLOSE
DBHLC-DOUBLE BAR HIGH LOWER CLOSE
IB-INSIDE BAR
S-SUPPORT
R-RESISTANCE
SW-SWING
C-CLOSE
O-OPEN
PA-PRICE ACTION
RN-ROUND NUMBER
TL-TREND LINE
RET-RETRACEMENT
CT-COUNTER TREND
SL-STOP LOSS
TP-TAKING PROFIT
BE-BREAK EVEN
RT-RETEST
H-HAMMER
SS-SHINING STAR
IH-INVERTED HAMMER
HM-HANGING MAN
IPB-INVERTED PIN BAR
MM-MONEY MANAGEMENT
RM-RANGE MARKET
DT-DOUBLE TOP
DB-DOUBLE BOTTOM
LL-LOWER LOW
LH-LOWER HIGH
HH-HIGHER HIGH
HL-HIGHER LOW
TF-TIME FRAME
M-MONTHLY
W-WEEKLY
D-DAILY
NCA-NO CLOSE ABOVE
NCB-NO CLOSE BELLOW
PTT&TTP-PLAN THE TRADE&TRADE THE PLAN
__________________
Presentation:
I'm a technical trader and this is not my method, it is a market's method. It is based on what we hear every day long:
-trade with the trade
-trade the retracements of the main trend.
This is long-live proved method and what I will explain here it is only what is works for me and the way it does !
The method.
a-Identify if the price is trendy market(up/down) on monthly and weekly charts, wait for a retracement with price action confirmation and entry on daily chart (buy at resistance and sell at support level).
b-Identify if the price is consolidating on monthly and weekly charts, wait the price to reach the top (down trend) and the bottom (up trend) and trade the consolidation in the main trend direction on daily chart.
The trading process has few rules/steps:
The market study
-the process of identifying what the price is doing: trend or range market.
-the process of identifying the support/resistance levels.
Psychology
-plan the trade-one of the most important in trading process is the trade plan, understanding what the price is doing, who is in the market control, waiting for the price to reach our levels and the emotion control.
We accept and we are taking all the responsibility for our actions as trades, entries, exits, etc.
Trading decision
-the fase when we have the confirmation by who is in the market control. we have a trading decision only if the price does what we are expecting, for all the rest of market situation…we stay out.
Entry
-only with price action confirmation to the choosen levels
-only with pending orders
-only above/bellow the first daily support/resistance level
Stop loss
-above/bellow the current swing
-above/bellow the first daily support/resistance level
Money management
-could be very different in base of our market analyse: trend/range market
-money management in trendy market: a-stop loss moved behind the last daily swing; b-stop loss moved behind the last weekly candle; c-stop loss moved behind the choosen levels (with daily entries, we are looking for monthly and weekly levels+ confluences); d-partial taking profit.
-money management in range market: a-the stop loss at break even as soon as possible: b-quickly partial profits of the most important levels from the inside of consolidation.
Risk
-all of the trades don’t have to exceed 2-3% of account’s size.
-capital preservation.
Exit
-to the support/resistance levels
-to the reverse candle/patterns
Trade’s analyse
-after every trade, we analyse it in order to learn from our own experience the positive and negative aspects of our trades.
Tools
-price action candles
-support/resistance levels
-patterns
-confluences
-trend lines
-channels
-Big Round Numbers and Round Numbers
-Fibbonacci levels.
Thread rules
-respect
-friendly environment
-no time frame lower than daily
-I lost pips and precious time with “dreams”…so no EA, lagging lines, indicators, etc.
Just a simple, clean chart with proper attitude is the best way to start being profitable !
Disclaimer
-the purpose of this thread is trading education/ experience to high quality level
-every trader is responsible for his own actions.
Thank you
fxgroup.
Abbreviations used:
P-PRICE
WPD-WHAT THE PRICE IS DOING
WPG-WHERE THE PRICE IS GOING
BUOB-BULLISH OUTSIDE BAR
BEOB-BEARISH OUTSIDE BAR
PB-PIN BAR
DBLHC-DOUBLE BAR LOW HIGHER CLOSE
DBHLC-DOUBLE BAR HIGH LOWER CLOSE
IB-INSIDE BAR
S-SUPPORT
R-RESISTANCE
SW-SWING
C-CLOSE
O-OPEN
PA-PRICE ACTION
RN-ROUND NUMBER
TL-TREND LINE
RET-RETRACEMENT
CT-COUNTER TREND
SL-STOP LOSS
TP-TAKING PROFIT
BE-BREAK EVEN
RT-RETEST
H-HAMMER
SS-SHINING STAR
IH-INVERTED HAMMER
HM-HANGING MAN
IPB-INVERTED PIN BAR
MM-MONEY MANAGEMENT
RM-RANGE MARKET
DT-DOUBLE TOP
DB-DOUBLE BOTTOM
LL-LOWER LOW
LH-LOWER HIGH
HH-HIGHER HIGH
HL-HIGHER LOW
TF-TIME FRAME
M-MONTHLY
W-WEEKLY
D-DAILY
NCA-NO CLOSE ABOVE
NCB-NO CLOSE BELLOW
PTT&TTP-PLAN THE TRADE&TRADE THE PLAN
__________________
Nothing personal,just business