PLEASE READ ALL OF THIS POST BEFORE TRADING!!!!!!
The only system one could ever want or truly need is right here.
I was taught this system from a friend of mine with a lot of forex knowledge.
I have a few threads on FF sharing with you a couple of my custom systems but this one here is the real deal. There's no custom or tricky indicators that repaint. Everything is already included in your platform. This is the system I use for my live trading and believe I always will. My custom systems are good but just don't fallow price like this one does.
My story in a nutshell,
I am a trader of 4 years with 3 of them being a bad experience till I was taught this system by a good friend. Now a year later I consistently make 20-50 pips a day only trading a couple hours.
Why I like this system,
-It's solid and works on the 5, 15, 1H, 4h, and daily time frames.
-I use it on the 5 nd 15 min.
-consistent Gains of 20-50 pips a day using it on the 5 and 15 min time frame per pair although I only trade the EU and GU.
System,
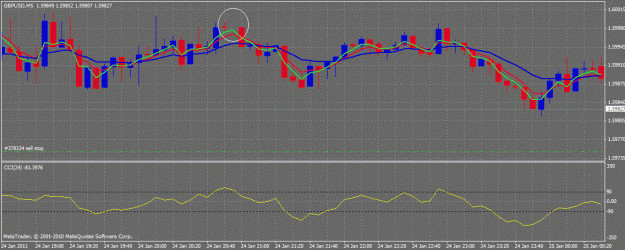
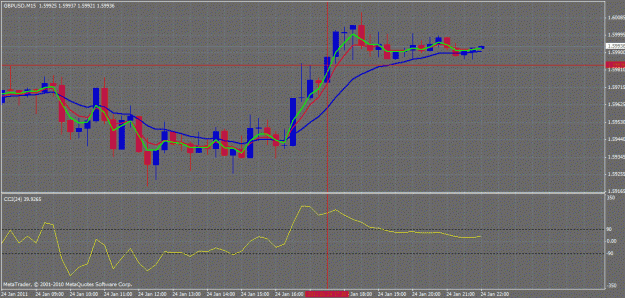
EMA's, 3,5 and 13
cci, 24 period fixed minimum of -350 and a maximum of 350
cci levels -90, 90
Sell:
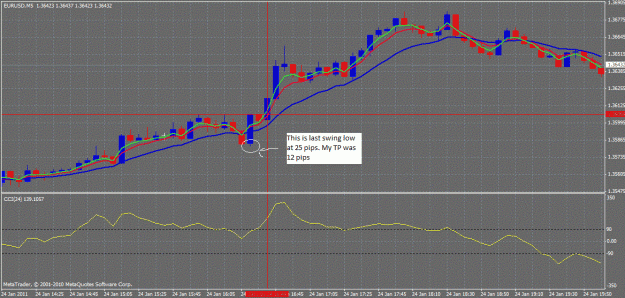
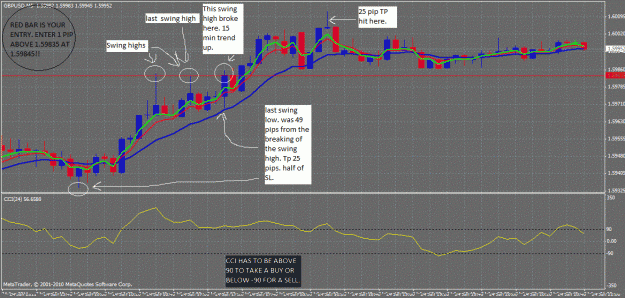
Check 5m chart for latest swing low.
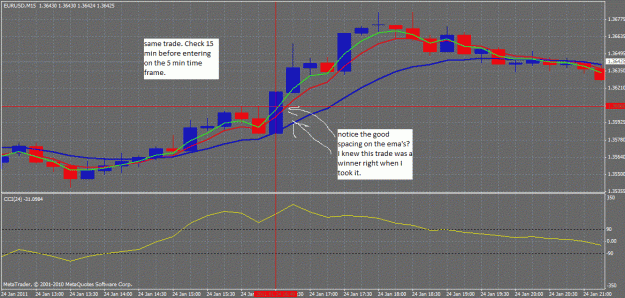
Check EMAs all heading down and spacing apart on 15m chart.
Enter trade on next break point on 5m chart when CCI is below 90 CCI
(not important in 15m chart)
EMAs must be heading down and spacing apart on 15m chart for entry.
(not important in 5m)
Stop loss 3 points above last swing high.
70% of Take profit at ½ Stop loss value 30% at 3 EMA crossing up through
13 EMA (on 5m chart).
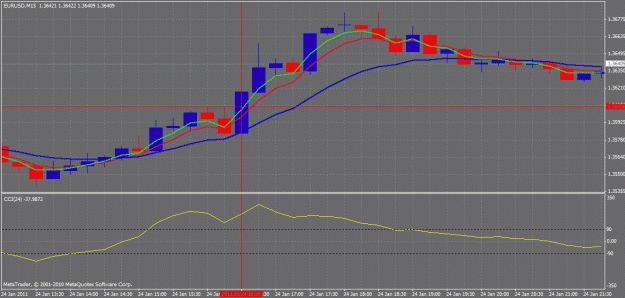
What is the lowest low?
It's when the current candle has at least 2 candles before and after that are higher then it itself. (Example is in pic.)
Buy:
Check 5m chart for latest swing high.
Check EMAs all heading up and spacing apart on 15m chart.
Enter trade on next break point on 5m chart when CCI is above +90 CCI.
(not important in 15m chart)
EMAs must be heading up and spacing apart on 15m chart for entry.
(not important in 5m)
Stop loss 3 points below last swing low.
70% of Take profit at ½ Stop loss value 30% at 3 EMA crossing down through 13 EMA (on 5m chart).
What is the highest high?
It's when the current candle has at least 2 candles before and after that are lower then it itself. (Example is in pic.)
Risk?
Max, Only 5% per trade.
While trading, make sure when your TP is hit to only take out 70% of the initial trade. Leave the other 30% in till 3 and 5 ema cross the 13. This will allow you to let your profits run, which is a must in forex trading!
Please do not change this method to your liking, keep it as it is. I've don't very well with this system over a long period of time. I've tried using it with many different indicators to try to make it better. Doing so just didn't make sense to the system. I even tried fib pivots. Also didn't make sense.
This system was meant to be traded as is. I've traded it for a year now and it's treated me very well so I hope you like it. Please give it a good shot with your trading. I've had a lot of people come to me asking how to trade profitably and this is the system that has helped me.
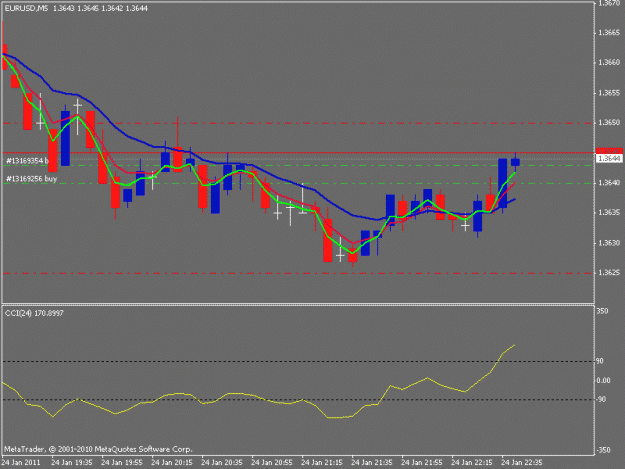
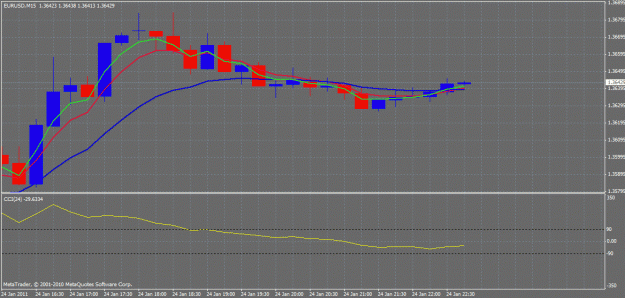
I will post my live trading pics here every day till thread is no more...
The only system one could ever want or truly need is right here.
I was taught this system from a friend of mine with a lot of forex knowledge.
I have a few threads on FF sharing with you a couple of my custom systems but this one here is the real deal. There's no custom or tricky indicators that repaint. Everything is already included in your platform. This is the system I use for my live trading and believe I always will. My custom systems are good but just don't fallow price like this one does.
My story in a nutshell,
I am a trader of 4 years with 3 of them being a bad experience till I was taught this system by a good friend. Now a year later I consistently make 20-50 pips a day only trading a couple hours.
Why I like this system,
-It's solid and works on the 5, 15, 1H, 4h, and daily time frames.
-I use it on the 5 nd 15 min.
-consistent Gains of 20-50 pips a day using it on the 5 and 15 min time frame per pair although I only trade the EU and GU.
System,
EMA's, 3,5 and 13
cci, 24 period fixed minimum of -350 and a maximum of 350
cci levels -90, 90
Sell:
Check 5m chart for latest swing low.
Check EMAs all heading down and spacing apart on 15m chart.
Enter trade on next break point on 5m chart when CCI is below 90 CCI
(not important in 15m chart)
EMAs must be heading down and spacing apart on 15m chart for entry.
(not important in 5m)
Stop loss 3 points above last swing high.
70% of Take profit at ½ Stop loss value 30% at 3 EMA crossing up through
13 EMA (on 5m chart).
What is the lowest low?
It's when the current candle has at least 2 candles before and after that are higher then it itself. (Example is in pic.)
Buy:
Check 5m chart for latest swing high.
Check EMAs all heading up and spacing apart on 15m chart.
Enter trade on next break point on 5m chart when CCI is above +90 CCI.
(not important in 15m chart)
EMAs must be heading up and spacing apart on 15m chart for entry.
(not important in 5m)
Stop loss 3 points below last swing low.
70% of Take profit at ½ Stop loss value 30% at 3 EMA crossing down through 13 EMA (on 5m chart).
What is the highest high?
It's when the current candle has at least 2 candles before and after that are lower then it itself. (Example is in pic.)
Risk?
Max, Only 5% per trade.
While trading, make sure when your TP is hit to only take out 70% of the initial trade. Leave the other 30% in till 3 and 5 ema cross the 13. This will allow you to let your profits run, which is a must in forex trading!
Please do not change this method to your liking, keep it as it is. I've don't very well with this system over a long period of time. I've tried using it with many different indicators to try to make it better. Doing so just didn't make sense to the system. I even tried fib pivots. Also didn't make sense.
This system was meant to be traded as is. I've traded it for a year now and it's treated me very well so I hope you like it. Please give it a good shot with your trading. I've had a lot of people come to me asking how to trade profitably and this is the system that has helped me.
I will post my live trading pics here every day till thread is no more...
Attached Image(s) (click to enlarge)
Attached File(s)