Forex Factory
  • Login

  • Username: Password:
  • 7:34am

  • Search
  • Home

  • Forums

  • Trades

  • Calendar

  • News

  • Market

  • Brokers

Options

Search
Search
Search

Subscribe to Thread

Bookmark Thread

First Page First Unread Last Page Last Post

Printable Version

Similar Threads

Help with Tom Demark indicator 27 replies

tom demark trendlines 2 replies

Auto pivots/Tom DeMark trendlines 1 reply

Anyone following Tom DeMark's methods? 2 replies

Tom Demark books? 0 replies

  • Trading Systems
  • /
  • Reply to Thread
  • 84

Tom demark Trendlines

  • Last Post
  • First Unread
  •  
  • Page 1 23456 15
  •  
  • Post# 1
  • Quote
  • First Post: Apr 28, 2007 6:51pm
  • Mr demark
    Joined Apr 2007 | 453 Posts | Status: Dont get greedy. Dont be too shy
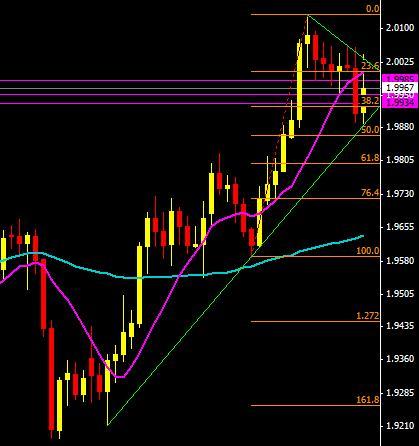
anyone here used TD T'L's? they are over 70% (closer to 90) accurate with breakouts.

using TD TL can profit on all timeframes down to 15M. scalpers and long term traders can profit from this. Also, u might not wait on a break of a TL but can trade its bounce i.e: the price is bouncing inside a triangle drawn by TD TL.

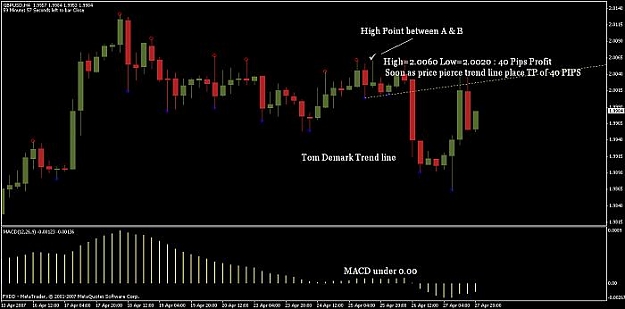
here is a picture of the bounces:


and here is a picture of a breakout:


notice how the last bar before breakout closed higher (breakout qualifier)

here are the breakout qualifiers:

Upside breakout qualifiers
Qualifier 1: The price bar prior to an upside breakout must be a down close.

Qualifier 2: The current price bar’s open must be greater than both the current TD Supply Line and the
previous price bar’s close and must then trade at least one tick higher.

Qualifier 3: The previous price bar’s close plus the previous bar’s “buying pressure” must be below the current
price bar’s TD Supply Line price level.

Qualifier 4: The current price bar’s open must be above both the previous two price bars’ closes, and the
current price bar’s TD Supply Line must be above the previous price bar’s high.

Downside breakout qualifiers

Qualifier 1: The price bar prior to a downside breakout must be an up close.

Qualifier 2: The current price bar’s open must be less than both the current TD Demand Line and the previous
price bar’s close and must then trade at least one tick lower.

Qualifier 3: The previous price close minus the previous bar’s “selling pressure” must be above the current
price bar’s TD Demand Line price level.

Qualifier 4: The current price bar’s open must be below both the previous two price bars’ closes, and the
current price bar’s TD Demand Line must be below the previous price bar’s low.

TD TL Indicator
Attached File
File Type: mq4 Ind-TD-DeMark-3.mq4   15 KB | 14,616 downloads
100% of traders are losers. Just that some win more than they lose!
  • Post# 2
  • Quote
  • Apr 28, 2007 7:00pm
  • Mr demark
    Joined Apr 2007 | 453 Posts | Status: Dont get greedy. Dont be too shy
one thing i must say, the method is most profitable the higher the timeframe.

i use it on H15 but i really want to use it on H1 and greater cuz 15m is well...more market noise than H1.

with TD TL, u risk very little trading TL bounces. in fact risking 10 pips is not uncommon for me for a TP of about 20 pips + spread.

pairs i watch (ranked):

usdjpy gbpusd eurusd usdchf eurjpy gbpchf


gbpjpy only on large TF as spread is a whopping 12 pips for me.
100% of traders are losers. Just that some win more than they lose!
  • Post# 3
  • Quote
  • Apr 28, 2007 7:30pm
  • ayato
    Joined Jan 2007 | 22 Posts | Status: Member
Very interesting thing you got here, so once price reaches some of these TD lines then there are a few options I think: trade the bounce, the breakout, or do nothing
  • Post# 4
  • Quote
  • Apr 28, 2007 7:32pm
  • alcastro
    Joined Sep 2006 | 505 Posts | Status: Pipchaser
Hi Mr.,

nice thread and very interesting topic. I am not an expert in DeMark, as you will be able to tell from my next question: What are the horizontal trend lines in the indicator? Are they support and resistance lines? What is the criteria used to draw them? I understand how the TL's are drwan, but would like some light around these horizontal ones.

On the other hand, it may be helpful if you post a chart explaining your system.

Thanks.
  • Post# 5
  • Quote
  • Apr 28, 2007 7:36pm
  • earret
    Joined Jun 2006 | 78 Posts | Status: Member
In your chart what does the "ShowingSteps=1" & "BackSteps=0" relate to?
  • Post# 6
  • Quote
  • Apr 28, 2007 7:47pm
  • ayato
    Joined Jan 2007 | 22 Posts | Status: Member
that's a daily trend line, look how on friday price hit 1.9865 and bounce off the line ... funny thing is a 50% fibo too.

Attached Image
  • Post# 7
  • Quote
  • Apr 28, 2007 7:51pm
  • kalil-jawwad
    Joined Jan 2007 | 26 Posts | Status: Member
I like Tom Demark trend lines and use them everyday in trading. Below is a simple method of trading using his method on the 4HR chart.
Attached Image (click to enlarge)
Click to Enlarge

Name: tom demark.jpg
Size: 31 KB
  • Post# 8
  • Quote
  • Apr 28, 2007 8:45pm
  • Mr demark
    Joined Apr 2007 | 453 Posts | Status: Dont get greedy. Dont be too shy
Quoting alcastro
Hi Mr.,

nice thread and very interesting topic. I am not an expert in DeMark, as you will be able to tell from my next question: What are the horizontal trend lines in the indicator? Are they support and resistance lines? What is the criteria used to draw them? I understand how the TL's are drwan, but would like some light around these horizontal ones.

On the other hand, it may be helpful if you post a chart explaining your system.

Thanks.
the Horizontal lines are calculated using TD's formulas (dont have the formulas now)

the horizontal lines are where the Take profit is best placed once TL are breached.

U can scale out profits as u go along. As for MT4 users who cant do this, i normally scale out using opposite trades.

example:
sell 3 lots of gbpusd. TP @ 1.9900, price is 1.9950.

how to scale this out?
place a buy limit of 1 lot 10 pips below the entry, 1.9940. with stop loss @ 3 lots TP of 1.9900

place another 1 lot 20 pips below @ 9930 with SL at same 1.9900.

this way u lock in profit as u go along even if u are not there. Also, once the original TP is hit, the two buy limits would be closed too.
100% of traders are losers. Just that some win more than they lose!
  • Post# 9
  • Quote
  • Apr 28, 2007 8:46pm
  • Mr demark
    Joined Apr 2007 | 453 Posts | Status: Dont get greedy. Dont be too shy
Quoting ayato
that's a daily trend line, look how on friday price hit 1.9865 and bounce off the line ... funny thing is a 50% fibo too.

Attachment 29930
it's not funny to me. It is rather Thrilling when these things happen..

i.e: indicator convergences
100% of traders are losers. Just that some win more than they lose!
  • Post# 10
  • Quote
  • Apr 28, 2007 8:46pm
  • Mr demark
    Joined Apr 2007 | 453 Posts | Status: Dont get greedy. Dont be too shy
Quoting earret
In your chart what does the "ShowingSteps=1" & "BackSteps=0" relate to?
showsteps shows trendlines of the past. backsteps is to allow lagging.

I dont use backsteps.


-----------------
ps, the indicator was not written by me,
100% of traders are losers. Just that some win more than they lose!
  • Post# 11
  • Quote
  • Apr 29, 2007 6:59am
  • Kaysole
    Joined Jul 2006 | 37 Posts | Status: Member
I thought that the points of the trendlines were supposed to be the highest/lowest candle within 2 candles to the left and right side of it. The indicator draws them differently, however. I'm confused on how to draw these trendlines. Could you please elaborate?
  • Post# 12
  • Quote
  • Apr 29, 2007 10:07am
  • Mr demark
    Joined Apr 2007 | 453 Posts | Status: Dont get greedy. Dont be too shy
Quoting Kaysole
I thought that the points of the trendlines were supposed to be the highest/lowest candle within 2 candles to the left and right side of it. The indicator draws them differently, however. I'm confused on how to draw these trendlines. Could you please elaborate?
are you sure? remember trendlines are drawn from right to left and remember lower trendlines ALWAYS tilt upwards and upper TL always tilt downwards

a lower TL is drawn from the low of the right to a LOWER low to the left
100% of traders are losers. Just that some win more than they lose!
  • Post# 13
  • Quote
  • Apr 29, 2007 10:29am | Edited Oct 17, 2008 4:51pm – Resize chart.
  • Mr demark
    Joined Apr 2007 | 453 Posts | Status: Dont get greedy. Dont be too shy
like this. Notice the red highs and blue lows.
Attached Image (click to enlarge)
Click to Enlarge

Name: 3329zc6.gif
Size: 9 KB
100% of traders are losers. Just that some win more than they lose!
  • Post# 14
  • Quote
  • Apr 29, 2007 10:56am
  • billbss
    Joined Apr 2006 | 3,459 Posts | Status: Member
I think that pure DeMarkism would disqualify the red trend line you have drawn.

It is violated by the high of the bar following the last fractal that it is drawn to.

I can't quote chapter and verse of DeMark's book that says that, but its in there somewhere.

If I get a chance, I'll try to find it.
  • Post# 15
  • Quote
  • Apr 29, 2007 11:09am
  • Mr demark
    Joined Apr 2007 | 453 Posts | Status: Dont get greedy. Dont be too shy
ok please find it
100% of traders are losers. Just that some win more than they lose!
  • Post# 16
  • Quote
  • Apr 29, 2007 11:23am
  • smjones
    Joined Mar 2006 | 4,460 Posts | Status: THANK YOU MERLIN,TWEE and FF Team
Quoting billbss
I think that pure DeMarkism would disqualify the red trend line you have drawn.

It is violated by the high of the bar following the last fractal that it is drawn to.

I can't quote chapter and verse of DeMark's book that says that, but its in there somewhere.

If I get a chance, I'll try to find it.
Please refer to page 37 chapter one s & P 500 left side of chart A X B ( between A and X )
Demark gives an example of a demand line drawn in the way Mr Demark as drawn his. I have searched the entire chapter on supply and demand trend lines and cannot find this restriction.

And again on page 41 and again on page 47
  • Post# 17
  • Quote
  • Apr 29, 2007 11:26am
  • Mr demark
    Joined Apr 2007 | 453 Posts | Status: Dont get greedy. Dont be too shy
billbss, thanks for the concern but i think the TL is ok
100% of traders are losers. Just that some win more than they lose!
  • Post# 18
  • Quote
  • Apr 29, 2007 11:27am
  • Mr demark
    Joined Apr 2007 | 453 Posts | Status: Dont get greedy. Dont be too shy
Quoting smjones
Please refer to page 37 chapter one s & P 500 left side of chart A X B ( between A and X )
Demark gives an example of a demand line drawn in the way Mr Demark as drawn his. I have searched the entire chapter on supply and demand trend lines and cannot find this restriction.

And again on page 41 and again on page 47
hey mr jones, what is the tile of that book? should be on amozon right
100% of traders are losers. Just that some win more than they lose!
  • Post# 19
  • Quote
  • Apr 29, 2007 11:28am
  • smjones
    Joined Mar 2006 | 4,460 Posts | Status: THANK YOU MERLIN,TWEE and FF Team
Quoting Mr demark
hey mr jones, what is the tile of that book? should be on amozon right
Yes, it is cheap and is called ( from $34.83 used)

The New Science Of Technical Analysis
  • Post# 20
  • Quote
  • Apr 29, 2007 11:28am
  • Mr demark
    Joined Apr 2007 | 453 Posts | Status: Dont get greedy. Dont be too shy
oh i think he meant this chart


that is indeed an error
100% of traders are losers. Just that some win more than they lose!
Thread Tools Search this Thread
Show Printable Version Show Printable Version
Email This Thread Email This Thread
Search this Thread:

Advanced Search

  • Trading Systems
  • /
  • Tom demark Trendlines
  • Reply to Thread
    • Page 1 23456 15
2 traders viewing now
  • More

©2013 Forex Factory, Inc. / Terms of Use / Privacy Policy

Forex Factory® is a registered trademark.

Connect

  • Facebook
  • Twitter
  • RSS

Company

  • About FF
  • FF Blog
  • Careers at FF
  • Advertising
  • Contact FF

Products

  • Forums
  • Trades
  • Calendar
  • News
  • Market
  • Brokers
  • Trade Explorer

Website

  • Homepage
  • Search
  • User Guide
  • Member List
  • Online Now
  • Report a Bug