Forex Factory
  • Login

  • Username: Password:
  • 4:20am

  • Search
  • Home

  • Forums

  • Trades

  • Calendar

  • News

  • Market

  • Brokers

Options

Search
Search
Search

Subscribe to Thread

Bookmark Thread

First Page First Unread Last Page Last Post

Printable Version

Similar Threads

Anybody write ea with bill williams' chaos theory? 12 replies

Bill Williams Profitunity Chaos Trading 438 replies

The 1st Wiseman in Chaos Trading/Profitunity 1 reply

Trading in the Zone advanced indicator (Trading Chaos by Bill Williams) 12 replies

Alligator System:Per Bill Williams book 12 replies

  • Trading Systems
  • /
  • Reply to Thread
  • 445

Profitunity (Chaos) Trading System by Bill Williams

  • Last Post
  • First Unread
  •  
  • Page 1 23456 73
  •  
  • Post# 1
  • Quote
  • First Post: Apr 17, 2007 2:58am
  • isto
    Joined May 2006 | 492 Posts | Status: Forex Trader
Hello traders,

I recently found out chaos system and read the books about it (by Bill Williams). I was convinced by the reading I tried the system for a while...

I seems worthable for me and I didn't find discussions here about this trading system and here it is:

Profitunity System

On the chart apply following tools
Alligator - Three SMAs (13/8/5) with a future offset of 8/5/3 respactively.
Fractals - 5 bars sequence where middle one has highest High / lowest Low and its preceded and followed two bars have lower highs / higher lows
preceded by two lower highs and is followed by two lower highs
Awesome Oscillator (AO) - difference between the 34-period and 5-period simple moving averages of the bar's midpoints (H+L)/2
Acceleration Oscillator (AC) - difference between 5/34 momentum histogram (AO) and a 5-bar simple moving average on the AO

To apply then into MetaTrader 4 platform use these menus
Alligator: Insert -> Indicators -> Bill Williams –> Alligator
Fractals: Insert -> Indicators -> Bill Williams –> Fractals
Awesome Oscillator: Insert -> Indicators -> Bill Williams –> Awesome Oscillator
Acceleration Oscillator: Insert -> Indicators -> Bill Williams –> Acceleration Oscillator
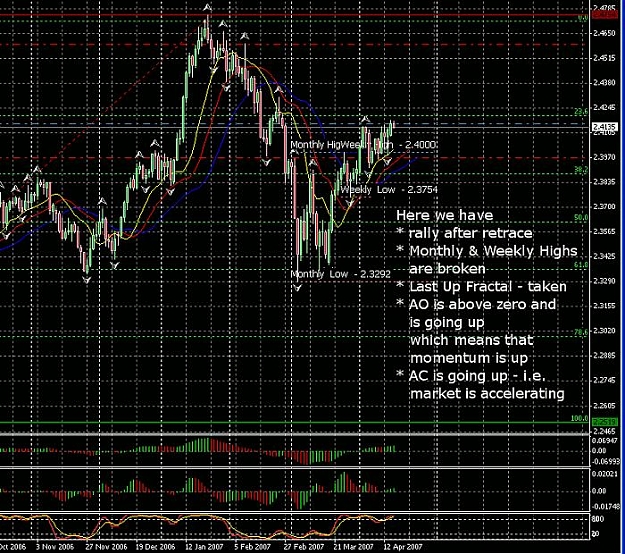

Entry:
When (Alligator) lines are opening we put a buy stop one point above the most recent fractal outside of the lines in trend direction

Exit:
When (Alligator) lines are closing we are closing too.

we stay out of the market when and while lines are intertwining.

Adding:
After the first fractal is taken, we take any and every signal in that direction.

Adding Entry Signals:
AO:
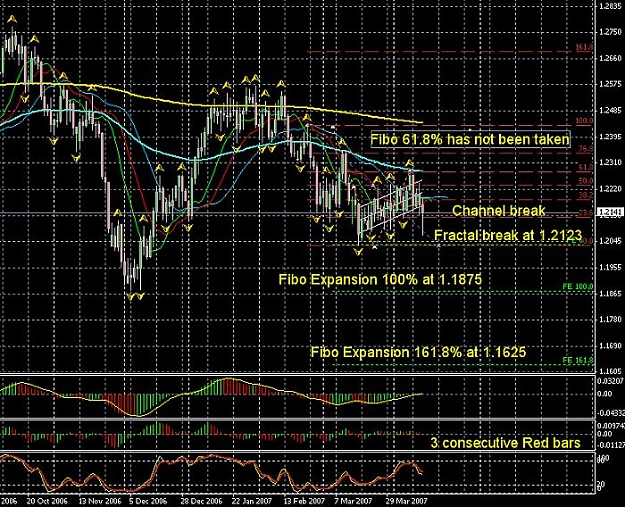
  1. we go long when AO cross zero line from negative to positive values and short on the opposite scenario.
  2. we go long we have 3 consecutive AO bars above zero line last two having higher highs (i.e. AO pulls back for a while)
- opposite for sell

AC:
  1. Go long after two consecutive bars above zero line
  2. Go long after three consecutive bars below zero line -
for short - reverse scenario

___________________________________ _____________________________
That's it. If you need more info - you could read more here
I'll try to answer any questions as best as I can...
  • Post# 2
  • Quote
  • Apr 17, 2007 3:03am
  • isto
    Joined May 2006 | 492 Posts | Status: Forex Trader
Hi again

For pictures describe faster than words I'll attache some of the charts I'm using...

Attached is USDCHF Daily setup on Apr 15 2007
Attached Image (click to enlarge)
Click to Enlarge

Name: bw-setup-20040415.jpg
Size: 125 KB
  • Post# 3
  • Quote
  • Apr 17, 2007 3:37am
  • isto
    Joined May 2006 | 492 Posts | Status: Forex Trader
Here is the chart from yesterday on GBPCHF Daily

be successful on trading!
Attached Image (click to enlarge)
Click to Enlarge

Name: bw-GBPCHF-setup-20070416.jpg
Size: 134 KB
  • Post# 4
  • Quote
  • Apr 17, 2007 3:44am
  • amaruenterprise
    Joined May 2006 | 276 Posts | Status: Member
Hi isto,
This is very interesting.Thanks for posting this it has my full attention of learning more about the chaos theory. What timeframes do you use ? Thanks in advance....
  • Post# 5
  • Quote
  • Apr 17, 2007 4:01am
  • WHTenn
    Joined Nov 2006 | 1,732 Posts | Status: Member
Isto...thread looking very good. What currency pairs have you used this on?

Good Luck
  • Post# 6
  • Quote
  • Apr 17, 2007 4:20am
  • isto
    Joined May 2006 | 492 Posts | Status: Forex Trader
Hello WHTenn,

Thank you for your interest...
Quoting WHTenn
Isto...thread looking very good. What currency pairs have you used this on?

Good Luck
I'm using majors but the method is described as univeral, i.e. any pair any market

Wish you positive trading

!i!
  • Post# 7
  • Quote
  • Apr 17, 2007 4:47am
  • isto
    Joined May 2006 | 492 Posts | Status: Forex Trader
Here is a good incoming setup for EURUSD H4 from today

Let's see what it will become. Which me good luck .
Attached Image (click to enlarge)
Click to Enlarge

Name: bw-EURUSD-setup-20070417.gif
Size: 41 KB
  • Post# 8
  • Quote
  • Apr 17, 2007 5:09am
  • isto
    Joined May 2006 | 492 Posts | Status: Forex Trader
There is another tool that could be useful

Gator: in MT use menu Insert -> Indicators -> Bill Williams –> Gator

It measues the distance between MA (Alligator) lines. It is useful because it shows you at a glance whether MAs are opening, closing or intertwining.

Trade after it becomes green.

Here is a sample&

when Gator is green - it is time to look around, but while there is not a fractal taken in this direction we do not enter the market

when Gator is red - it is time to take profit and/or wait for the next chance

Hope it will be useful to your trading

!i!
Attached Image
  • Post# 9
  • Quote
  • Apr 17, 2007 6:12am
  • melpheos
    Joined Jan 2007 | 1,597 Posts | Status: Stochastic pipster
That's too many indicator for me to handle but it seems good at first glance
  • Post# 10
  • Quote
  • Apr 17, 2007 6:33am
  • isto
    Joined May 2006 | 492 Posts | Status: Forex Trader
Quoting melpheos
That's too many indicator for me to handle but it seems good at first glance
It seems so and also at first reading seems complicated but it is not. The longer you are with it the better it seems to be.

Well that;s my point of view of caurse...

Good luck

!i!
  • Post# 11
  • Quote
  • Apr 17, 2007 11:05am
  • isto
    Joined May 2006 | 492 Posts | Status: Forex Trader
This is continuation of post #7
EURUSD on H4

USD Core CPI m/m data caused fractal to be taken on 1.3579 so I'm long 1 contract
Attached Image (click to enlarge)
Click to Enlarge

Name: bw-EURUSD-LongEntry-20070417.gif
Size: 32 KB
  • Post# 12
  • Quote
  • Apr 20, 2007 3:03am | Edited at 3:26am
  • isto
    Joined May 2006 | 492 Posts | Status: Forex Trader
Here is a sample of an unfortunate trade

I've made a mistake with stop loss place. After the 6th consecutive red AO bar I should place the stopLoss above the last-1 bar's high and move it accordingly.

Here is final result
Inserted Code
DateSignalPriceSLP/L
19.4.2007 14:44F1.63371.6396-0.0059-590
20.4.2007 14:45AC1.63371.6396-0.0059-590
21.4.2007 14:48Z1.63391.6396-0.0057-570

Total: -1 750 
Attached Image
  • Post# 13
  • Quote
  • Apr 20, 2007 3:18am | Edited at 5:16am
  • isto
    Joined May 2006 | 492 Posts | Status: Forex Trader
Here is how USDCHF Daily trade (from post #2) develops.

Because of the strong decline - stopLoss is tighten. 69 points profit for the moment.
Attached Image
  • Post# 14
  • Quote
  • Apr 20, 2007 4:10am | Edited at 5:16am
  • isto
    Joined May 2006 | 492 Posts | Status: Forex Trader
USDCHF Daily trade (start is in post #2; there are some explanations in post #14 )
closed by stopLoss with 52 point profit...
not bad, eh?
Attached Image
  • Post# 15
  • Quote
  • Apr 20, 2007 4:53am | Edited at 12:39pm
  • isto
    Joined May 2006 | 492 Posts | Status: Forex Trader
Here is a nice looking setup for USDJPY 1 hours chart.

I've missed first three entry points... Hope this will be for good ... (profit)
Attached Image
  • Post# 16
  • Quote
  • Apr 20, 2007 10:04am | Edited at 12:39pm
  • isto
    Joined May 2006 | 492 Posts | Status: Forex Trader
Here's how develops USDJPY H1 trade described in post #16.

All Stop orders triggered. StopLoss moved below the new down fractal.
Attached Image (click to enlarge)
Click to Enlarge

Name: usdjpy-open-20070420-16.gif
Size: 20 KB
  • Post# 17
  • Quote
  • Apr 20, 2007 11:22pm
  • james275
    Joined Nov 2005 | 125 Posts | Status: Member
I have heard that there are many different reasons to take signals. Are you takin just the fractals or the other ones as well. Can you provide rules?

THanks...
  • Post# 18
  • Quote
  • Apr 21, 2007 1:59am
  • isto
    Joined May 2006 | 492 Posts | Status: Forex Trader
Hi james275,
Quoting james275
I have heard that there are many different reasons to take signals. Are you takin just the fractals or the other ones as well. Can you provide rules?

THanks...
I've tried to describe signals in my 1st post here.

Here under I'll try to summarize them in brief...:
There are 5 tools issuing signals:
One enter the market when 1st fractal (#1) out of the lines is hit again.
Once on the market one opens a new order is same direction when any of the other signals is triggered.
These are: AO(#2), AC(#3), Zone(#4) and Balance Line(#5).

Some of them issue more than one signal.
If more than one signal is triggered simultaneously - corresponding number of orders are opened.

I personaly am taking each of the signal until my money management rules allow this.

I've tried to comment the charts attached in previous posts, pointing where signals are and where stops are.

If you have any questions please let me know - I'll do my best to answer them.

!i!

BTW - this method is described in "New Trading Dimensions" book by Bill Williams.
There is slight alterations of the system in his next book "Trading Chaos" 2nd edition
  • Post# 19
  • Quote
  • Apr 21, 2007 2:43am
  • isto
    Joined May 2006 | 492 Posts | Status: Forex Trader
I have two pair with open orders for this week.

Here is the state of USDJPY H1 at the end of work-days. (You could see begining of the trade in post #16 and post #17)
The picture does not seems quite promising.

If the last compleated bar closes below Red Line (alligator teeth) - trade must be closed and I'll be kicked out.

Worst is that this will case losses...
Attached Image (click to enlarge)
Click to Enlarge

Name: usdjpy-endofweek-20070421.gif
Size: 24 KB
  • Post# 20
  • Quote
  • Apr 21, 2007 3:18am
  • isto
    Joined May 2006 | 492 Posts | Status: Forex Trader
Here is current stage of the other trade before the week-end - EURUSD H4
(you could follow this trade in post #7, post #11 and post #12)

Situation is the same as above (USDJPY) ...
Must exit if last compleated bar closes below red line - somewhere about 1.3682.

The good news is that there is no loss
Expected profit is about 29 000

The bad news is that this is a Demo account

We'll see...

wish you fascinating week-end

$i!
Attached Image
Thread Tools Search this Thread
Show Printable Version Show Printable Version
Email This Thread Email This Thread
Search this Thread:

Advanced Search

  • Trading Systems
  • /
  • Profitunity (Chaos) Trading System by Bill Williams
  • Reply to Thread
    • Page 1 23456 73
0 traders viewing now
  • More

©2013 Forex Factory, Inc. / Terms of Use / Privacy Policy

Forex Factory® is a registered trademark.

Connect

  • Facebook
  • Twitter
  • RSS

Company

  • About FF
  • FF Blog
  • Careers at FF
  • Advertising
  • Contact FF

Products

  • Forums
  • Trades
  • Calendar
  • News
  • Market
  • Brokers
  • Trade Explorer

Website

  • Homepage
  • Search
  • User Guide
  • Member List
  • Online Now
  • Report a Bug