Forex Factory
  • Login

  • Username: Password:
  • 8:47am

  • Search
  • Home

  • Forums

  • Trades

  • Calendar

  • News

  • Market

  • Brokers

Options

Search
Search
Search

Subscribe to Thread

Bookmark Thread

First Page First Unread Last Page Last Post

Printable Version

Similar Threads

Technical Analysis Fallacy 40768 replies

The fallacy of Metatrader EA trading contests 18 replies

The Ultimate Fallacy in Technical Analysis 94 replies

Statistical analysis fallacy 33 replies

  • Trading Discussion
  • /
  • Reply to Thread
  • 5

Technical Analysis Fallacy Redux

  • Last Post
  • First Unread
  •  
  • Page 1 2
  •  
  • Post# 1
  • Quote
  • First Post: Sep 15, 2010 4:30am
  • Mindsphere
    Joined Jul 2009 | 250 Posts | Status: Member
I tuned in and out of the other thread on this, and I've made a post of my own questioning whether any purely technical approach could really be profitable. I didn't want my post to get lost in the other thread (it's far too long), so for the benefit of all I've started this thread. Over the last 6 months I've come full circle and am starting to comprehend, from an intellectual perspective, how trading without an eye on the fundamentals nor on any "outside" information can work.

First point I wish to address is terminology. When I say technical analysis I don't mean RSI indicators and whatnot. I mean trend-lines, channels, support and resistance levels, round numbers and "price action", collectively viewed on various different timeframes. By price action I mean things like pinbars, outside bars, bullish and bearish bars which show momentum (relative to previous bars). I think many people place weight on bar closes on different timeframes, so I think this is an important point too. e.g. a closed pinbar has more weight than a pinbar-in-progress.

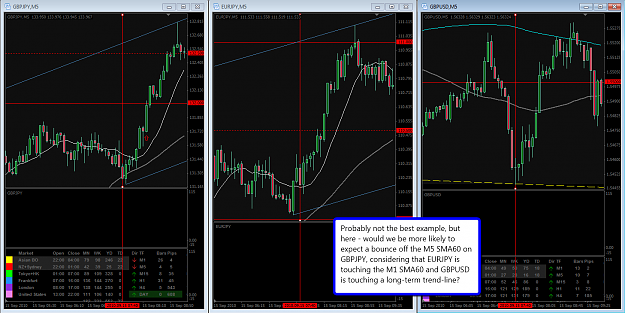
I believe that all of these "technicals" are meaningless on their own. Price approaching a round number is not a reason in and of itself to fade a touch. It might be a reason to watch price action there, however. If you add a long-term trend-line and prior resistance, and you couple that with a good M5 pinbar however - that might be a good enough reason to fade the touch.

Basically, I think the key to profitability is to take in as much information as one can about current market movements to derive some sort of sentiment. We can read the psychology of price movements through the various factors that other traders will be utilising.

One more thing - I find myself disagreeing with those who believe that higher timeframes are "more reliable". I think that higher timeframe movements - by their very essence - are more open to shifts in the fundamentals. Fundamentals can drive big shifts in the market on the weekly, daily, 4 hourly - perhaps even hourly charts. Jump down to the M15/M5/M1 and you've got what many people call noise. I believe this "noise" is in fact a whole lot of technically-based trading, plus some market manipulation.

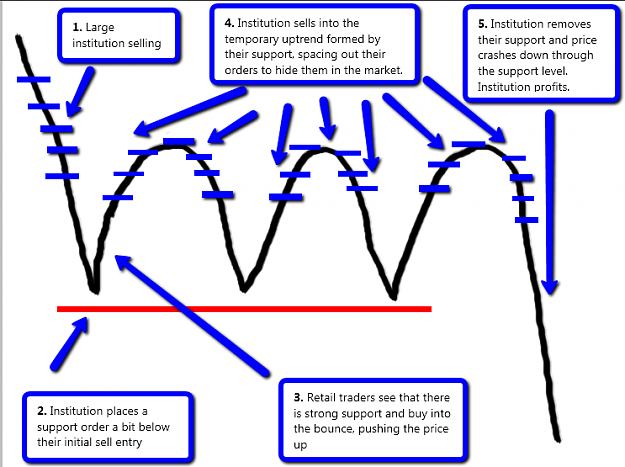
That brings me to my last point - market manipulation. I think one of the keys to good success on these lower timeframes is learning to identify market manipulation. I work at an institution which is big enough to push a market around (it's not forex and unfortunately I get no chop). We don't use charts, we just use the order book. A conversation the other day led me to draw the following image to try and explain something that I do almost every day to get a lot of volume at a good price:

Attached Image (click to enlarge)
Click to Enlarge

Name: vshapedbounce.png
Size: 103 KB


I'm interested to hear thoughts on all of the above, and I might flesh out a few more of my ideas in the process of the thread.
  • Post# 2
  • Quote
  • Sep 15, 2010 7:08am
  • mahdiquant
    Joined Jun 2010 | 107 Posts | Status: Newbie
Excellent post. That shows that some prices which are supposed to be support/resistance levels are in fact "artificial" s/r levels and cannot be reliable.
  • Post# 3
  • Quote
  • Sep 15, 2010 4:48pm
  • baron193
    Joined May 2006 | 763 Posts | Status: Member
Quoting mahdiquant
Excellent post. That shows that some prices which are supposed to be support/resistance levels are in fact "artificial" s/r levels and cannot be reliable.
Lol, support and resistance are also called BID and OFFER areas or zones or other similar terms, when people look at S/R levels that is what they watch in play even if not conciously know about it, what is the difference?
Once you become fluent in S/R trading you will forget the Fundamentals behind them and just trade the "price action".
Biggest joker
  • Post# 4
  • Quote
  • Sep 15, 2010 5:46pm
  • The Fool
    Joined Apr 2009 | 6,617 Posts | Status: Member
your graphic is right out of the VSA playbook

http://www.forexfactory.com/showthread.php?t=157629
"If The Fool persists in his Folly he will become wise." - William Blake
  • Post# 5
  • Quote
  • Sep 15, 2010 6:21pm
  • Deusomega
    Joined Apr 2009 | 624 Posts | Status: Member
Quoting The Fool
your graphic is right out of the VSA playbook

http://www.forexfactory.com/showthread.php?t=157629
Where's the image @? in that thread. On his buddy list is TudorGirl so beware
  • Post# 6
  • Quote
  • Sep 15, 2010 6:24pm
  • Jhig
    Joined Oct 2008 | 2,267 Posts | Status: End of Day, Position Trader
Quoting baron193
Lol, support and resistance are also called BID and OFFER areas or zones or other similar terms, when people look at S/R levels that is what they watch in play even if not conciously know about it, what is the difference?
Once you become fluent in S/R trading you will forget the Fundamentals behind them and just trade the "price action".
Spot on post baron!

In fact I've found that once I was experienced enough with S/R, all I cared about was answering the question, "what will price do with this level"? Not an easy question to answer without basic knowledge of major/minor levels. A typical trader can be very successful if he/she can identify the S/R level and react quickly to what price does near the level.

I use to think S/R level didn't work well in forex but as I learned more about spot intraday forex trading I found out levels are more important in spot than in equities or futures (futures market invented S/R levels). The basic fundamental pricing movement in forex is based on S/R levels. When you trade a pair so convoluted as EURUSD, you may not notice the S/R pricing pattern. Its not until you experience other, non-popular pairs (particularly crosses) you truly see the power of S/R levels.

Any S/R level tool set will work. From past price to trendlines, channels, pitch forks, fibs, Gann, whole numbers would all do just fine. The key is to identify and anticipate what price will do with the nearest level.
  • Post# 7
  • Quote
  • Sep 15, 2010 6:29pm
  • The Fool
    Joined Apr 2009 | 6,617 Posts | Status: Member
Quoting Deusomega
Where's the image @? in that thread. On his buddy list is TudorGirl so beware
I was speaking figuratively.
"If The Fool persists in his Folly he will become wise." - William Blake
  • Post# 8
  • Quote
  • Sep 15, 2010 6:33pm
  • Deusomega
    Joined Apr 2009 | 624 Posts | Status: Member
Quoting The Fool
I was speaking figuratively.
Darn I was hoping it was that easy lol. That he literally copied an image. But really the image is fairly common sense. Ofc a large trader(institution) is selling to push market down. And ofc he wants a good price so he will buy some too to give the appearance of momentum coming into the market northbound. And ofc when the large trader is done and no one is there to suck up the sell orders at the previous level the price will drop because the liquidity is consumed at that previous support level. Paul Tudor Jones did this in the doc Trader lol.
  • Post# 9
  • Quote
  • Sep 15, 2010 6:36pm
  • Mindsphere
    Joined Jul 2009 | 250 Posts | Status: Member
Quoting Deusomega
Where's the image @? in that thread. On his buddy list is TudorGirl so beware
Hah. I was a newbie once upon a time who bought all of his/her tripe

I actually couldn't figure out how to remove him/her from my buddy list.

Edit: Unbuddied. Happy now?
  • Post# 10
  • Quote
  • Sep 15, 2010 6:37pm
  • Mindsphere
    Joined Jul 2009 | 250 Posts | Status: Member
Quoting The Fool
your graphic is right out of the VSA playbook

http://www.forexfactory.com/showthread.php?t=157629
I'm quite sceptical about VSA (in regards to spot FX anyway) as it's based on tick volume which, imho, is rubbish. Great post on this topic here: http://tremblinghandtrader.typepad.c...ue-volume.html
  • Post# 11
  • Quote
  • Sep 15, 2010 6:41pm
  • Deusomega
    Joined Apr 2009 | 624 Posts | Status: Member
Quoting Mindsphere
Hah. I was a newbie once upon a time who bought all of his/her tripe

I actually couldn't figure out how to remove him/her from my buddy list.
Hmm click you're name up in the upper left corner of teh website then on the left hand side scroll down to misc and click Buddy list and bingo:

"To remove a user from your Buddy List, un-check the box associated with their avatar and click the 'Save Changes' button."

Cmon you work for a big market moving firm you got this!
  • Post# 12
  • Quote
  • Sep 15, 2010 6:41pm
  • The Fool
    Joined Apr 2009 | 6,617 Posts | Status: Member
Quoting Mindsphere
I'm quite sceptical about VSA (in regards to spot FX anyway) as it's based on tick volume which, imho, is rubbish. Great post on this topic here: http://tremblinghandtrader.typepad.c...ue-volume.html
yeah, I'd agree with that. But the futures volume is readily available and futures/spot rates track together. I usually watch the ES volume as I trade E/U during NY. By my comment above I only meant that your diagram illustrated what is commonly spotted using VSA.
"If The Fool persists in his Folly he will become wise." - William Blake
  • Post# 13
  • Quote
  • Sep 15, 2010 6:43pm
  • The Fool
    Joined Apr 2009 | 6,617 Posts | Status: Member
Quoting Deusomega
Hmm click you're name up in the upper left corner of teh website then on the left hand side scroll down to misc and click Buddy list and bingo:
lol I dint know how to do that either. Thanks Deus!
"If The Fool persists in his Folly he will become wise." - William Blake
  • Post# 14
  • Quote
  • Sep 15, 2010 6:44pm
  • Deusomega
    Joined Apr 2009 | 624 Posts | Status: Member
Quoting The Fool
lol I dint know how to do that either. Thanks Deus!
Yeah I've never messed with it(I have no friends lol) but figured hey I'm a genius I'll take a look at my profile lol.
  • Post# 15
  • Quote
  • Sep 15, 2010 6:47pm
  • Mindsphere
    Joined Jul 2009 | 250 Posts | Status: Member
Quoting The Fool
yeah, I'd agree with that. But the futures volume is readily available and futures/spot rates track together. I usually watch the ES volume as I trade E/U during NY. By my comment above I only meant that your diagram illustrated what is commonly spotted using VSA.
Ah fair enough. However, I'm curious as to how you're using futures forex volume as any sort of leading indicator. It was my impression that futures pricing is simply a function of remaining time versus the current spot. Also, the low volumes traded mean that it's not really representative of the spot fx market, plus any publicly visible levels are probably visible for a reason. All that said.. if it works for you go for it

Actually, re-reading your post - did you mean you watch the S&P for correlation with the EU?

As for my diagram, I don't know how often you'll see it come out clearly in a chart.. or on what time-frames. I just know that's what my activity would look like if it were charted. Banks probably use a variety of different methods to build up volume...
  • Post# 16
  • Quote
  • Sep 15, 2010 6:54pm
  • Mindsphere
    Joined Jul 2009 | 250 Posts | Status: Member
On the topic of correlation, I definitely get the concept, and I'm starting to use it in my own trading. What I'm wondering is if anyone could care to illuminate me as to in what ways they use correlation.

What seems logical to me (when trading on lower time-frames), is to analyse the chart and make note of potential areas where price might stall or bounce. For example, when trading the GBPJPY, one could watch the EURJPY or the GBPUSD or both (could suffer from information overload, but still). If we see price approaching a long-term trend-line on GBPUSD, a round number of EURJPY, and GBPJPY is in the middle of a pull-back which suggests a promising entry is on its way, would one approach be to take the entry once we've seen corresponding pinbars close on all three currencies, and conversely - to not take the entry if, for example, GBPUSD blasts through its trend-line?

This example assumes that the currencies are all moving in the same direction before the entry, obviously.
  • Post# 17
  • Quote
  • Sep 15, 2010 6:59pm
  • The Fool
    Joined Apr 2009 | 6,617 Posts | Status: Member
Quoting Mindsphere
Actually, re-reading your post - did you mean you watch the S&P for correlation with the EU?

...
right, ES has high liquidity during NY. Correlation is variable, though - its just another tiny clue.
"If The Fool persists in his Folly he will become wise." - William Blake
  • Post# 18
  • Quote
  • Sep 15, 2010 7:00pm
  • Mindsphere
    Joined Jul 2009 | 250 Posts | Status: Member
Just thought I would add to my post with this image... best I can do after a long night-shift. But it should make my thoughts a little clearer.

Attached Image (click to enlarge)
Click to Enlarge

Name: correlation2.png
Size: 100 KB


Edit: Ignore the entry arrow, it's not relevant to this question.
  • Post# 19
  • Quote
  • Sep 16, 2010 3:55am
  • Mindsphere
    Joined Jul 2009 | 250 Posts | Status: Member
Let me add to this thread with a couple of correlation trades I just made. They weren't ultimately that successful because I exited to early. The question I would ask more experienced traders here is whether or not my reasons for exiting were a little too conservative? As for my correlation approach, does this seem solid?

Finally, I hate to ask - but if anyone feels like vouching for me I'd really like to start a "Good trade, bad trade?" thread in Interactive Trading and need 4 vouches minimum.

Thanks!

Attached Image (click to enlarge)
Click to Enlarge

Name: gbpjpy3on16092010.png
Size: 118 KB
  • Post# 20
  • Quote
  • Sep 16, 2010 4:26am
  • Mindsphere
    Joined Jul 2009 | 250 Posts | Status: Member
And another...

Attached Image (click to enlarge)
Click to Enlarge

Name: gbpjpy4on16092010.png
Size: 111 KB
Thread Tools Search this Thread
Show Printable Version Show Printable Version
Email This Thread Email This Thread
Search this Thread:

Advanced Search

  • Trading Discussion
  • /
  • Technical Analysis Fallacy Redux
  • Reply to Thread
    • Page 1 2
0 traders viewing now
  • More

©2013 Forex Factory, Inc. / Terms of Use / Privacy Policy

Forex Factory® is a registered trademark.

Connect

  • Facebook
  • Twitter
  • RSS

Company

  • About FF
  • FF Blog
  • Careers at FF
  • Advertising
  • Contact FF

Products

  • Forums
  • Trades
  • Calendar
  • News
  • Market
  • Brokers
  • Trade Explorer

Website

  • Homepage
  • Search
  • User Guide
  • Member List
  • Online Now
  • Report a Bug