This is in response to POP83 system which some folks are trying to comprehend, hopefully POP will drop in and answer a couple of questions.
First I must give respect to Cobra and the THV CLAN for the development of the mother system which earned alot of pips for a lot of folks. Now we are enhancing or tweaking it a bit with a new templet which has the ability to add filter to the charts. POPEE83 presented the templet and since I am a fan of the 5 min chart and the gbp/usd currency this aroused my interest. I (tracom) do not have any interest in selling anything. as stated before I just want to learn a decent system and be on my way. This thread is intended for all to learn from POPEE83 who appears to be an experienced trader. I do realized that his time is limited but hopefully we can grab whatever we can. All suggestions are welcomed and encouraged, if someone has another indicator they would like to introduce by all means BARGE IN to the forum and do so. If its going to make money for everybody who cares.
Manual: By POPEE83
Well, Folks .... straight to the point:
INTRO:
The system we'll name Katy Perry System. It comprises 3 main sub systems, namely: m-fibo, X_fibo and Centre of Gravity (CoG). It's core approach to calling trades is based on median trading ...
demo the system first ..... and not for sale ...
median trading:
m-fibo: We divide the trading day as a whole into fibo quartiles. m-fibo does this for us auto. These quartiles given by m-fibo will give us the trading ranges on either side ... up or down the trading day in question.. The quartiles have the m-fibo yellow line as equilibrium (pivot). To the upside, the first line is .382, the second is .618 and the third 1.0 projection. Same applies to the downside from the pivot.
x_fibo: This indicator serves as the cluster provider and also measure fib levels for each fresh day .. it's also auto ... The top solid gold is the previous day's high and the lower blue solid line is the previous day's low ...
The centre golden dotted fib lines subdivide the previous day while the upper and lower lines with + & - are break outs ....
Center of Gravity (COG): A fascinating indicator this one.... this is the "trade what you see" steering wheel... more or less like Sir Isaac Newton's LAW OF GRAVITY. This works better than even fib arcs.... The middle blue line is the core of the gravitational pull in the markets ... The upper/lower green lines are the acceptable trading ranges .. and the further two golden lines are extremes ... little oxygen their ...
SIGNAL INDICATORS:
1. sidus-crossover: This indi. has alerts. Has two hollow arrows ..
blue/yellow. Also has two boxes .. yellow and blue ... blue arrow - long,
yellow arrow - short
2. ZigandZag: This one has got the two solid arrows .. blue (long) and red
short).. also has a white spot (pause in trend) ... white spot comes in
handy trimming draw downs ....
3. SHI-silvertrend:Here we have the two round/circular blue (long) and
red (short) dots...
BEGINNERS RULES:
ENTRY:
LONG: sidus indi's blue hollow arrow appears for a long time ... The COG curve is facing north on the m15 TF or m5 TF, if scalping .... TP set at 1/2 ATR value ... don't target to catch up with the upper green line of COG for TP. SL set at ATR value.
SHORT: sidus indi's yellow hollow arrow appears for a long time ... The COG curve is facing south on the m15 TF or m5 TF, if scalping .... TP set at 1/2 ATR value ... don't target to catch up with the lower green line of COG for TP. SL set at ATR value
After a cycle.. wait for the next sidus in tandem with the COG direction ... to re-enter....
EXIT:
TP/SL hit ......
Caution: Short term trend expected to change or experience extreme resistance whenever we hit a fibo cluster zone .... ( to be explained later on ...)
............
EXTRAS: For daredevils ... you can ride the sidus signals ...in the trend direction of COG .. temporarily exiting on appearance of SHI or ZigZag ... that is against trend, and re-entering uppon appearance of the next SHI or ZigZag in tandem with the trade ... Carefully respect x_fibo nodes while at it ...
m-candle ... is a huge H4 TF shadow and aids in trend identification ....
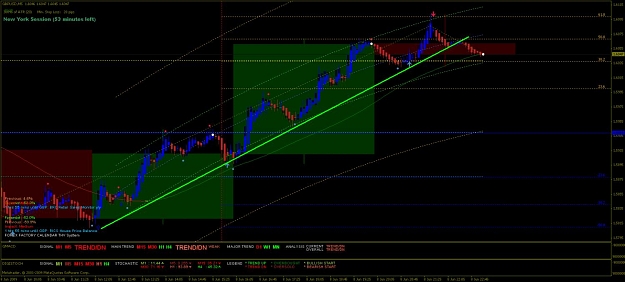
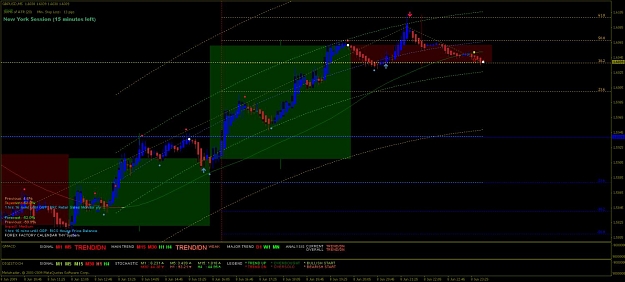
See attached pictures to identify the signals and interprate them as advised ....
SUPPORT & RESISTANCE (FIB CLUSTER ZONES)
Please refer to past posts and see how the trading ranges were determined ... as well as the R & S zones picked out... This lines are from the convergence of m-fibo projections with X_fibo ... very crucial zones that command a high degree of respect .... both for the trading day in day in question and for historical reference ....
First I must give respect to Cobra and the THV CLAN for the development of the mother system which earned alot of pips for a lot of folks. Now we are enhancing or tweaking it a bit with a new templet which has the ability to add filter to the charts. POPEE83 presented the templet and since I am a fan of the 5 min chart and the gbp/usd currency this aroused my interest. I (tracom) do not have any interest in selling anything. as stated before I just want to learn a decent system and be on my way. This thread is intended for all to learn from POPEE83 who appears to be an experienced trader. I do realized that his time is limited but hopefully we can grab whatever we can. All suggestions are welcomed and encouraged, if someone has another indicator they would like to introduce by all means BARGE IN to the forum and do so. If its going to make money for everybody who cares.
Manual: By POPEE83
Well, Folks .... straight to the point:
INTRO:
The system we'll name Katy Perry System. It comprises 3 main sub systems, namely: m-fibo, X_fibo and Centre of Gravity (CoG). It's core approach to calling trades is based on median trading ...
demo the system first ..... and not for sale ...
Shout outs
Tracom...a great guy .. takes risks to learn new things ...
Ams.. .. the voice of reason here ...
DOVO, Giff, S.ED
all of you beginners as well as new learners
My Girl.. Katy Perry for inspiring the mentality
median trading:
m-fibo: We divide the trading day as a whole into fibo quartiles. m-fibo does this for us auto. These quartiles given by m-fibo will give us the trading ranges on either side ... up or down the trading day in question.. The quartiles have the m-fibo yellow line as equilibrium (pivot). To the upside, the first line is .382, the second is .618 and the third 1.0 projection. Same applies to the downside from the pivot.
x_fibo: This indicator serves as the cluster provider and also measure fib levels for each fresh day .. it's also auto ... The top solid gold is the previous day's high and the lower blue solid line is the previous day's low ...
The centre golden dotted fib lines subdivide the previous day while the upper and lower lines with + & - are break outs ....
Center of Gravity (COG): A fascinating indicator this one.... this is the "trade what you see" steering wheel... more or less like Sir Isaac Newton's LAW OF GRAVITY. This works better than even fib arcs.... The middle blue line is the core of the gravitational pull in the markets ... The upper/lower green lines are the acceptable trading ranges .. and the further two golden lines are extremes ... little oxygen their ...
SIGNAL INDICATORS:
1. sidus-crossover: This indi. has alerts. Has two hollow arrows ..
blue/yellow. Also has two boxes .. yellow and blue ... blue arrow - long,
yellow arrow - short
2. ZigandZag: This one has got the two solid arrows .. blue (long) and red
short).. also has a white spot (pause in trend) ... white spot comes in
handy trimming draw downs ....
3. SHI-silvertrend:Here we have the two round/circular blue (long) and
red (short) dots...
BEGINNERS RULES:
ENTRY:
LONG: sidus indi's blue hollow arrow appears for a long time ... The COG curve is facing north on the m15 TF or m5 TF, if scalping .... TP set at 1/2 ATR value ... don't target to catch up with the upper green line of COG for TP. SL set at ATR value.
SHORT: sidus indi's yellow hollow arrow appears for a long time ... The COG curve is facing south on the m15 TF or m5 TF, if scalping .... TP set at 1/2 ATR value ... don't target to catch up with the lower green line of COG for TP. SL set at ATR value
After a cycle.. wait for the next sidus in tandem with the COG direction ... to re-enter....
EXIT:
TP/SL hit ......
Caution: Short term trend expected to change or experience extreme resistance whenever we hit a fibo cluster zone .... ( to be explained later on ...)
............
EXTRAS: For daredevils ... you can ride the sidus signals ...in the trend direction of COG .. temporarily exiting on appearance of SHI or ZigZag ... that is against trend, and re-entering uppon appearance of the next SHI or ZigZag in tandem with the trade ... Carefully respect x_fibo nodes while at it ...
m-candle ... is a huge H4 TF shadow and aids in trend identification ....
See attached pictures to identify the signals and interprate them as advised ....
SUPPORT & RESISTANCE (FIB CLUSTER ZONES)
Please refer to past posts and see how the trading ranges were determined ... as well as the R & S zones picked out... This lines are from the convergence of m-fibo projections with X_fibo ... very crucial zones that command a high degree of respect .... both for the trading day in day in question and for historical reference ....
Attached File(s)