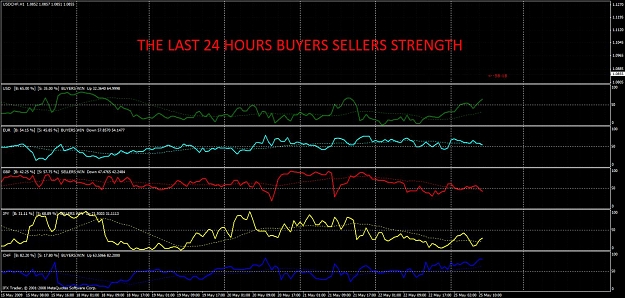
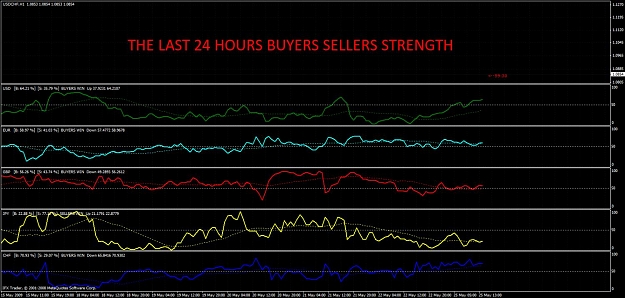
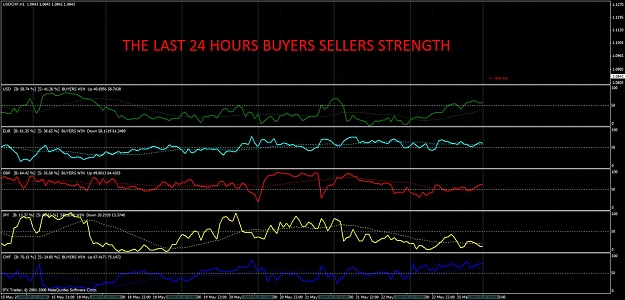
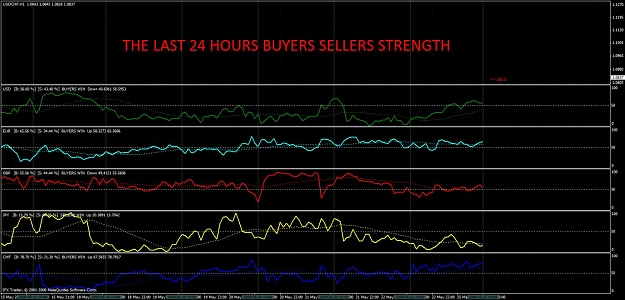
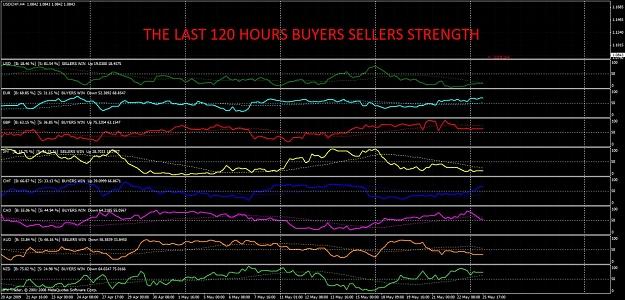
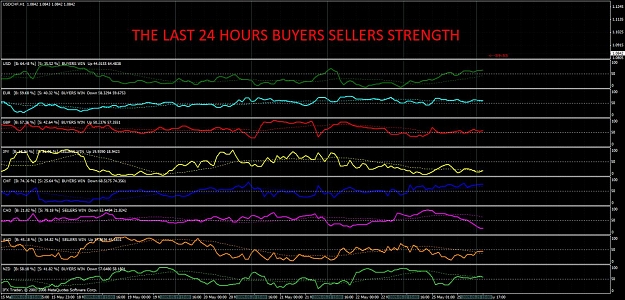
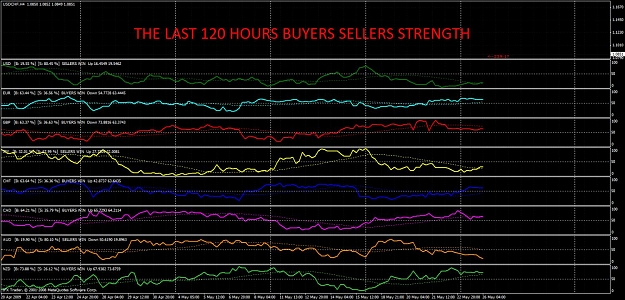
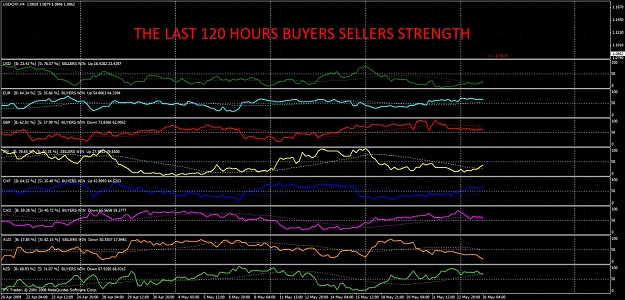
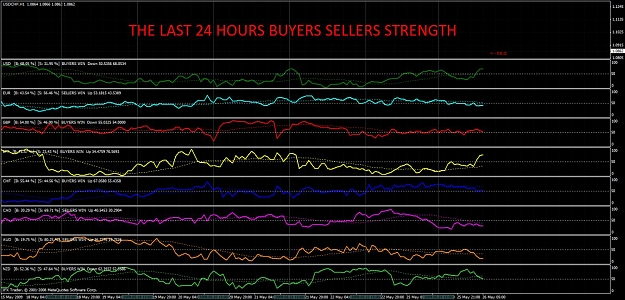
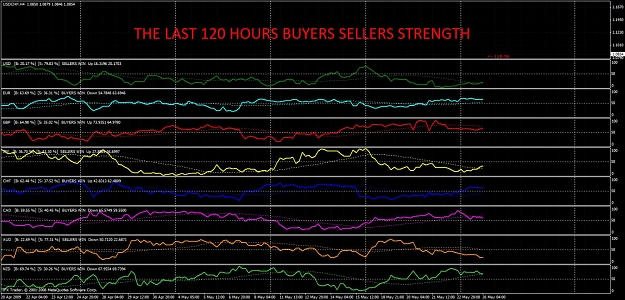
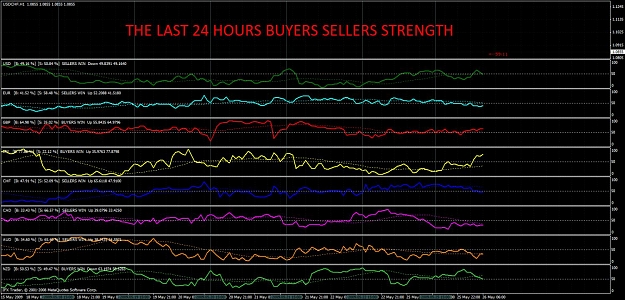
Hi, i open this thread to share the Buyers and Sellers strength for each currency for the last 24 hours & the last 120 hours (5 days). You can use this informations for your trade.. And i'll try to post it every hours when the new candle on H1 TF is formed. Please, don't ask me to post the indicator...
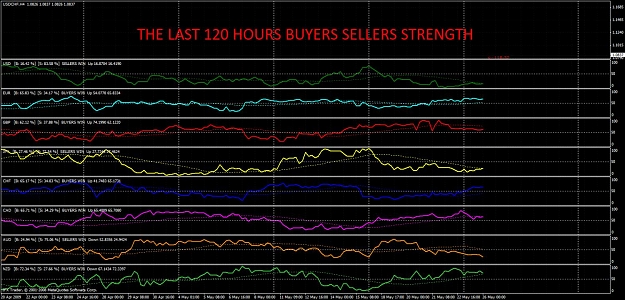
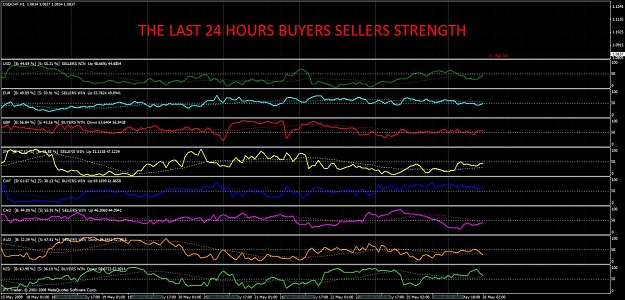
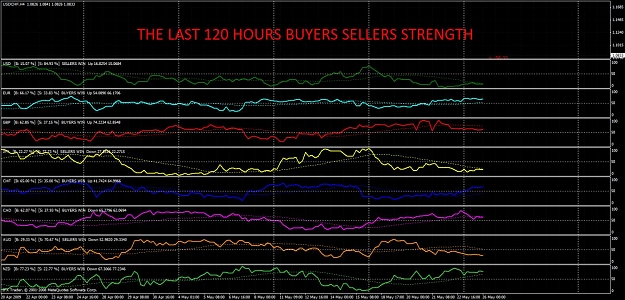
Here is how to read it, on the left corner of each currency windows you will see "B" for Buyers Strength in % and "S" for Sellers Strength in %. Bold line draw the Buyers strength in %, and the DOT LINE is smothing of this strength for the last 24 hours strength I use 24 candles smoothing on H1 Time Frame and for the 120 hours strength i use 30 candles smoothing on H4 Time frame. And there is a simple words too that tell you who is the winer currently "BUYERS WIN" means buyers strength is bigger than 50% and "SELLERS WIN" means sellers strength is bigger than 50%. And i put there too "Up" and "Down" word too that tell you the current strength direction compare to the previous strength.
Hope it's help
KG