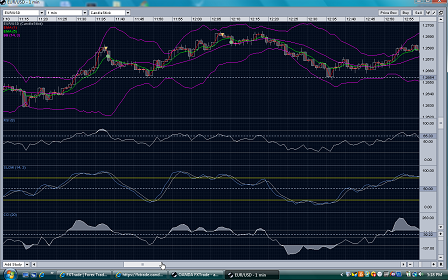
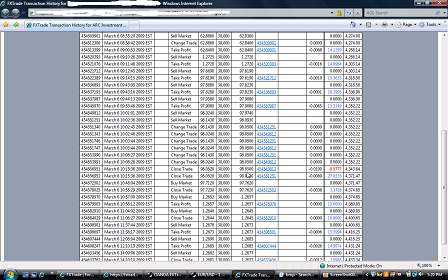
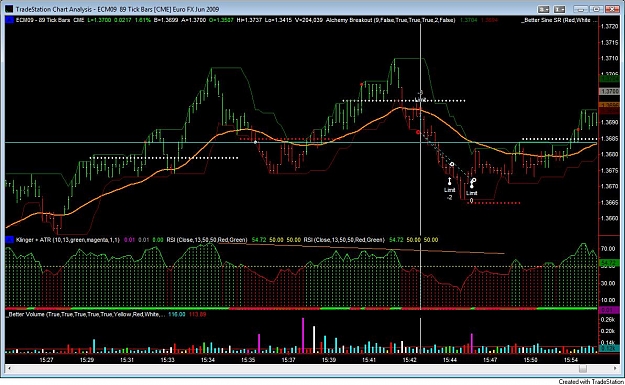
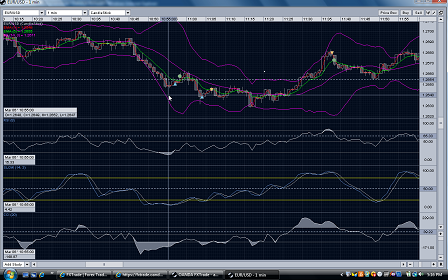
Forex Factory
  • Login

  • Username: Password:
  • 5:49am

  • Search
  • Home

  • Forums

  • Trades

  • Calendar

  • News

  • Market

  • Brokers

Options

Search
Search
Search

Subscribe to Thread

Bookmark Thread

First Page First Unread Last Page Last Post

Printable Version

  • Interactive Trading
  • /
  • Reply to Thread
  • 219

EUR/USD Scalp 1 min

  • Last Post
  • First Unread
  •  
  • 1 34Page 567 45
  •  
  • Post# 81
  • Quote
  • Apr 14, 2009 11:15am
  • hoss
    Joined Jun 2006 | 564 Posts | Status: Theee Ohio State University
Here's kinda what I do. A few on the EU from today. The first trade was a little risky - a winner but I had to average in. I don't recommend those. Anyway the next few were nice. Price was reaching a pivot/murrey line with nice divergence. See the chart. If you did these once a day, you will be making some nice money. These happen all day on the 1 minute chart. Notice how I would only open up new longs once we saw new lows with price along with divergence. Allow price to push down before you enter. I made 25-30 pips off of these trades.
Attached Image (click to enlarge)
Click to Enlarge

Name: eur.jpg
Size: 59 KB
  • Post# 82
  • Quote
  • Apr 14, 2009 11:29am
  • Horn
    Joined Apr 2009 | 85 Posts | Status: Member
Quoting hoss
Here's kinda what I do. A few on the EU from today. . Notice how I would only open up new longs once we saw new lows with price along with divergence. Allow price to push down before you enter. I made 25-30 pips off of these trades.
Hi Hoss,

What time was the chart extracted from? Sorry , unable to follow or see how to determine the new lows refered in the chart. Further help from you greatly appreciated.

Thanks
  • Post# 83
  • Quote
  • Apr 14, 2009 11:37am
  • hoss
    Joined Jun 2006 | 564 Posts | Status: Theee Ohio State University
Quoting Horn
Hi Hoss,

What time was the chart extracted from? Sorry , unable to follow or see how to determine the new lows refered in the chart. Further help from you greatly appreciated.

Thanks
it's the one minute chart from this morning EDT. the up arrows are where i entered trades and they are always lower in price than the previous. basically i am getting in trades at better prices as we see divergence.
  • Post# 84
  • Quote
  • Apr 14, 2009 11:58am
  • Horn
    Joined Apr 2009 | 85 Posts | Status: Member
Thanks Hoss. Now I understand ( I Think). The arrows indicate the various times u entered long and made the pips when the price went up.
  • Post# 85
  • Quote
  • Apr 14, 2009 12:10pm
  • colbru
    Joined Oct 2006 | 64 Posts | Status: Member
Thank you Hoss

For the Chart... gives plenty to discuss about.

First: I am amazed seeing that you took the trades without having a touche of the BB. ( I was thinking that you were only pulling the trigger on RSI 20/80 and touch of BB... obviously not!)

Second: the divergence you were trading was with wery low RSI values..
What when the divergence does not work... I mean if the price follows through and makes new lows and new RSI low...? Isn't that risky..?

Thank you for your insight...

Best
  • Post# 86
  • Quote
  • Apr 14, 2009 12:15pm
  • hoss
    Joined Jun 2006 | 564 Posts | Status: Theee Ohio State University
be back in a bit to explain....
  • Post# 87
  • Quote
  • Apr 14, 2009 6:17pm
  • hoss
    Joined Jun 2006 | 564 Posts | Status: Theee Ohio State University
Quoting colbru
Thank you Hoss

For the Chart... gives plenty to discuss about.

First: I am amazed seeing that you took the trades without having a touche of the BB. ( I was thinking that you were only pulling the trigger on RSI 20/80 and touch of BB... obviously not!)

Second: the divergence you were trading was with wery low RSI values..
What when the divergence does not work... I mean if the price follows through and makes new lows and new RSI low...? Isn't that risky..?

Thank you for your insight...

Best
I do pull the trigger on the OB/OS, but only in certain situations - new high - new low with nice price movement. As far as divergence goes, yes, sometimes it does not work. But, if you wait for price to make mew highs/lows it works beautifully. Price is either breaking out, consolidating, or retracing. Don't ever take trades during consolidation - it is waiting to breakout. I'm not a breakout trader. I wait for consolidation, then a breakout, and I wait to trade the retracement. Get in the habit of identifying which phase you are in, and you will do well. To trade safely, just take retracements after 3 pushes with divergence against support/resistance. It is a great way to trade. As you get better, you can make other trades when you see them.
  • Post# 88
  • Quote
  • Apr 14, 2009 6:23pm
  • hoss
    Joined Jun 2006 | 564 Posts | Status: Theee Ohio State University
I don't use the bollinger bands too much. I use them after a hard push. You will see that price does not like to be outside of the bands. If it does, and is up against a pivot/murrrey, it will usually retrace pretty quickly. I pick 5 pips up on these alot. I try and enter when price/candle is outside of a band on an aggresive push where there is support/resistance. I do not wait for a reversal candle in these instances. If you use indicators in an unconventional way, you will be surprised what you can do. Think contrarian. Think about what the guy that is losing is doing, and do the opposite.
  • Post# 89
  • Quote
  • Apr 14, 2009 9:10pm | Edited at 9:22pm
  • Toothman
    Joined Aug 2006 | 1,241 Posts | Status: Member
Can you describe how you're averaging in your second and third trades when trade goes against you? How much do you increase lot size , or do you just increase the TP on the additional trades? l Thanks
  • Post# 90
  • Quote
  • Apr 14, 2009 9:11pm
  • MIA_Austrian
    Joined Jul 2008 | 9 Posts | Status: Member
Hi hoss what values do you have for your Bollinger Bands?

Thanks for sharing this method with us, it works great and is very easy to understand.
  • Post# 91
  • Quote
  • Apr 14, 2009 10:17pm
  • hoss
    Joined Jun 2006 | 564 Posts | Status: Theee Ohio State University
Quoting MIA_Austrian
Hi hoss what values do you have for your Bollinger Bands?

Thanks for sharing this method with us, it works great and is very easy to understand.
I have the standard set which I believe is 2.
  • Post# 92
  • Quote
  • Apr 15, 2009 12:58am
  • NetEnt
    Joined Apr 2009 | 9 Posts | Status: Member
I've tried it and this method truly is excellent. Thanks.
  • Post# 93
  • Quote
  • Apr 15, 2009 9:08am
  • alifari
    Joined Mar 2009 | 279 Posts | Status: Member
Hi Hoss,

I found your strategy quite interesting. However, I have one question. What timeframe you use for Murray Math Lines, Is it daily?

Looking forward for your reply.

Thanks,

af
To achieve success, we must dream as well as act.....
  • Post# 94
  • Quote
  • Apr 15, 2009 10:04am
  • mtaesler
    Joined Apr 2009 | 8 Posts | Status: Member
Hi Hoss,
good system

I use 15min charts for support/resistance level and trade with 30sec charts (with rsi and bollinger)

fantastic results

thanks
  • Post# 95
  • Quote
  • Apr 15, 2009 11:20am
  • colbru
    Joined Oct 2006 | 64 Posts | Status: Member
Hi Hoss and other traders

I tried some trading today and got burnded because there were huge up and down moves on the EUR. I pulled the trigger at 80/20 RSI level...
Are you waiting for the close of the 1min candle?

Best
  • Post# 96
  • Quote
  • Apr 15, 2009 11:50am
  • hoss
    Joined Jun 2006 | 564 Posts | Status: Theee Ohio State University
I don't wait for the close of the candle in most instances. You can't trade every 80/20. Wait for exhaustion if you can. If you can't spot it, try using trendlines to get in on some counter moves. Demo until you get it - you will get it.
  • Post# 97
  • Quote
  • Apr 15, 2009 12:09pm
  • TradeStar
    Joined Feb 2007 | 454 Posts | Status: Member
Quoting colbru
Hi Hoss and other traders

I tried some trading today and got burnded because there were huge up and down moves on the EUR. I pulled the trigger at 80/20 RSI level...
Are you waiting for the close of the 1min candle?

Best
Hi Colbru,

Today's move was not easy for scalping. That's why like Hoss says it takes good amount of screen time. It is not about just 80 20 levels only. Initially what you could do is to look for Bearish outside bar or Bullish outside bar on 1 minute along with OB / OS levels. This can give some confidence.

Keep practicing

Good luck

TradeStar
Haste not to Enter AND Haste not to Exit ! -TradeStar
  • Post# 98
  • Quote
  • Apr 15, 2009 1:46pm
  • colbru
    Joined Oct 2006 | 64 Posts | Status: Member
Quoting TradeStar
Hi Colbru,

Today's move was not easy for scalping. That's why like Hoss says it takes good amount of screen time. It is not about just 80 20 levels only. Initially what you could do is to look for Bearish outside bar or Bullish outside bar on 1 minute along with OB / OS levels. This can give some confidence.

Keep practicing

Good luck

TradeStar
Hi Tradestar, Hoss

Thank you for your support...

What do you mean with the Bearish/Bullish Outside Bar..
When RSI gets over 80 and I see a Bearish outside bar formed go short?
I guess you did not mean it that way... but that's the only setup I can picture with an outsidebar...

I must say this thread is a gem to me...! I love this style of trading...

In general I'd like to ask you guys that already mastered this to post some screenhots showing some trades..
I'd really appreciate that.... because I think it would help anyone reading this thread.

Best
colbru
  • Post# 99
  • Quote
  • Apr 15, 2009 1:54pm
  • colbru
    Joined Oct 2006 | 64 Posts | Status: Member
Let me show you a screenshot...

Disregard the first "trade triangle" it's a close from a long term trade...

I tried to listen to Hoss and did draw a trendline and waited till price almost reached it and the RSI level was reeeal high... so I pulled the trigger...

Does it look good to you..? I'm open to your input and suggestions...

Best
colbru
Attached Image (click to enlarge)
Click to Enlarge

Name: Bild 1.PNG
Size: 146 KB
  • Post# 100
  • Quote
  • Apr 15, 2009 6:06pm
  • hoss
    Joined Jun 2006 | 564 Posts | Status: Theee Ohio State University
Quoting colbru
Let me show you a screenshot...

Disregard the first "trade triangle" it's a close from a long term trade...

I tried to listen to Hoss and did draw a trendline and waited till price almost reached it and the RSI level was reeeal high... so I pulled the trigger...

Does it look good to you..? I'm open to your input and suggestions...

Best
colbru
Good trade. However, I usually draw the trendline underneath price in this instance. I am looking for the breakout south in this situation, not necessarily off the top trendline. But it may work for you this way. Do what works for you. I think you will get pretty good set ups this way. You entered at a great price, too, because price was outside the first bollinger band also. You also had about 3 nice pushes/waves up, too. And, nice distance away from the 200 ema.
Thread Tools Search this Thread
Show Printable Version Show Printable Version
Email This Thread Email This Thread
Search this Thread:

Advanced Search

  • Interactive Trading
  • /
  • EUR/USD Scalp 1 min
  • Reply to Thread
    • 1 34Page 567 45
0 traders viewing now
  • More

©2013 Forex Factory, Inc. / Terms of Use / Privacy Policy

Forex Factory® is a registered trademark.

Connect

  • Facebook
  • Twitter
  • RSS

Company

  • About FF
  • FF Blog
  • Careers at FF
  • Advertising
  • Contact FF

Products

  • Forums
  • Trades
  • Calendar
  • News
  • Market
  • Brokers
  • Trade Explorer

Website

  • Homepage
  • Search
  • User Guide
  • Member List
  • Online Now
  • Report a Bug