Hallo, I have marked a price pattern, but it is unclear for me. I need your help.
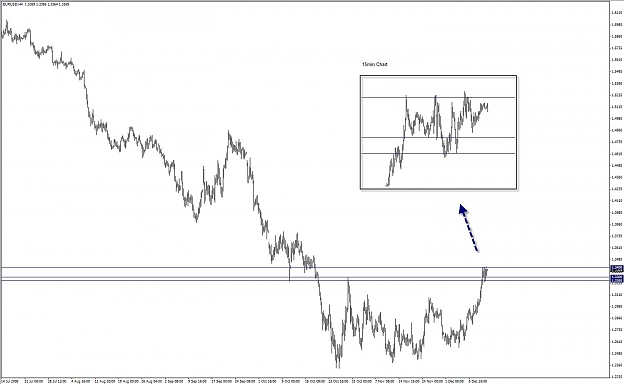
By this pattern the price makes NH and NL, but the NL are very deep and overlap the preceding NH and then comes a powerfull breakout. Sometimes that looks like a rising wedge but not always. The same is and in the downmove. Could someone give me any ideas or information. Thank you.
Here are the charts:
http://www.imagefreehost.com/files/1...0673048599.gif
http://www.imagefreehost.com/files/1...5674403808.gif
http://www.imagefreehost.com/files/1...9860564265.gif