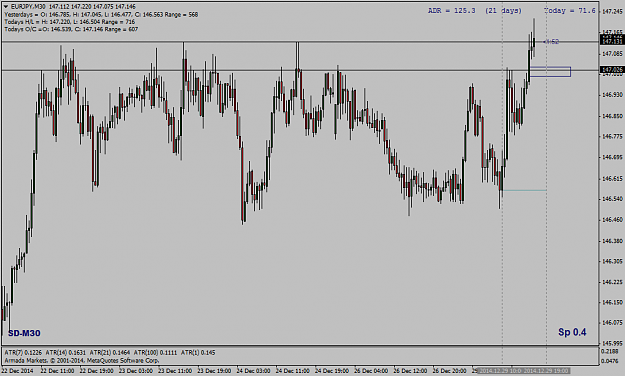
CHART EXAMPLE: EURJPY PA TRADE (Didn't take this trade but good for example purpose)
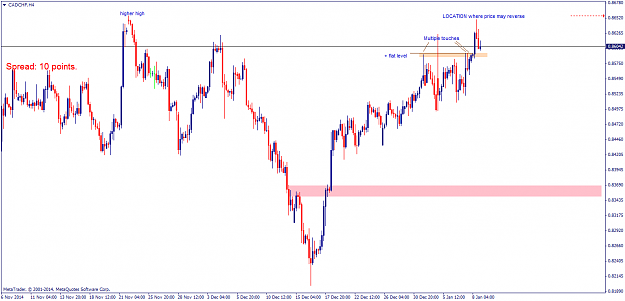
M30 chart show price approaching at important resistance level. The ongoing price action on M30 suggest buyers in action, so the better option would be looking for PA on lower time frame at that important resistance level and pre-empting a breakout with tight SL aiming for next resistance level.
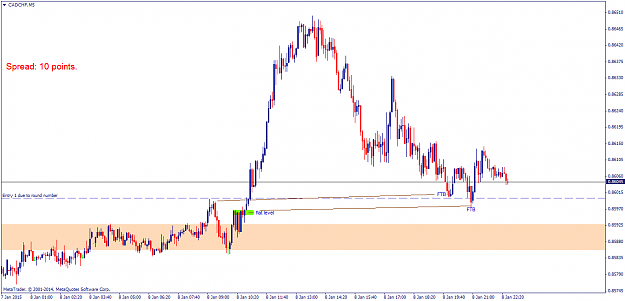
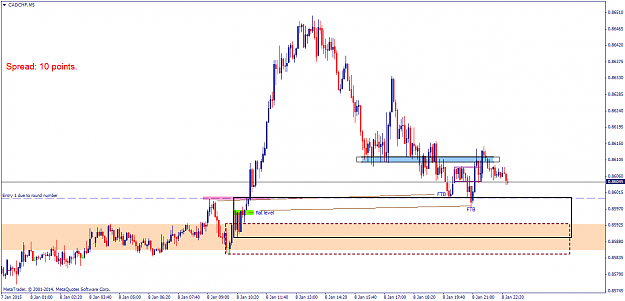
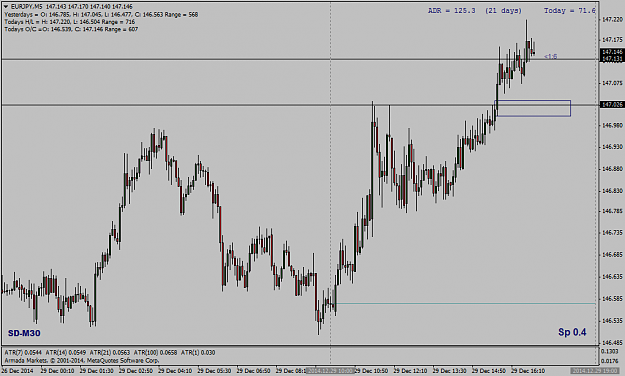
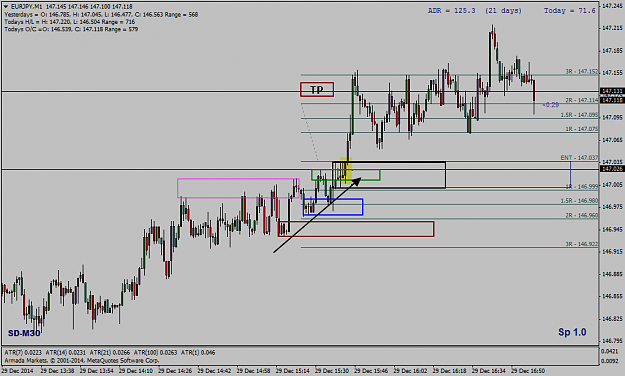
On M1 chart before the breakout, we can clearly see consumption of supply and new demand zone being established and price making higher lows while approaching resistance level. The green bullish bar closing above the resistance level after couple of spikes bar was our signal to go long with SL below this bar and target next resistance level.
M30 chart show price approaching at important resistance level. The ongoing price action on M30 suggest buyers in action, so the better option would be looking for PA on lower time frame at that important resistance level and pre-empting a breakout with tight SL aiming for next resistance level.
On M1 chart before the breakout, we can clearly see consumption of supply and new demand zone being established and price making higher lows while approaching resistance level. The green bullish bar closing above the resistance level after couple of spikes bar was our signal to go long with SL below this bar and target next resistance level.
Attached Image(s) (click to enlarge)
The purpose of knowledge is action, not knowledge