In the name of God the Merciful
Relative Strength Index (RSI) is one of the most widely used technical indicators by traders.
Benchmark index of the relative strength of the group because it is a volatile index tends to oscillate between the value of the maximum and minimum. It is used primarily to assist in determining the conditions of purchase or sale in a particular currency, as it is designed to range between 0 and 100 and determine the direction of uptrend and subsidies and resistance and breakage real and fake warning and rolling on the possibility of a change uptrend and tells you if the price in the case of fluctuate as the master of Mowhrat
If properly used as follows:
1 It is a momentum indicator and oscillate between a scale of 0-100.
2 has two basic functions to explain the price is overbought / oversold and,
3 as they determine the price movement by forming patterns, such as Double top or bottom Top, Head & Shoulders, etc., and this sort of thing myself no longer be seen, and for me I will know Benchmark
4 and will generate more references accurate market movements and trends and diavarstion
We will deal with the rsi with a new way
Will know how to take advantage of the innovative ways rsi 9
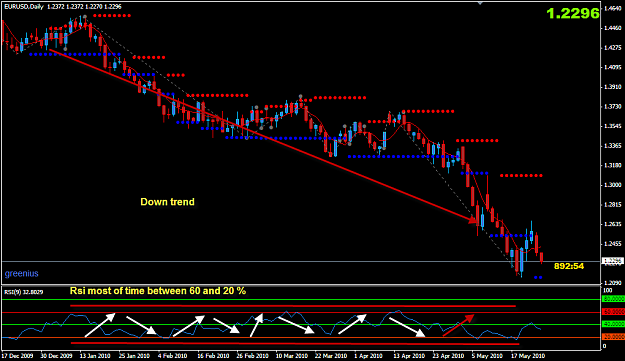
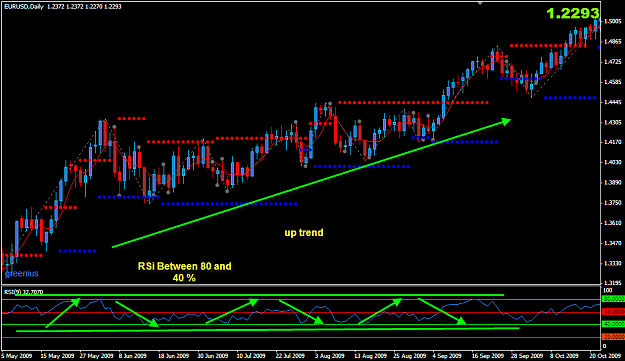
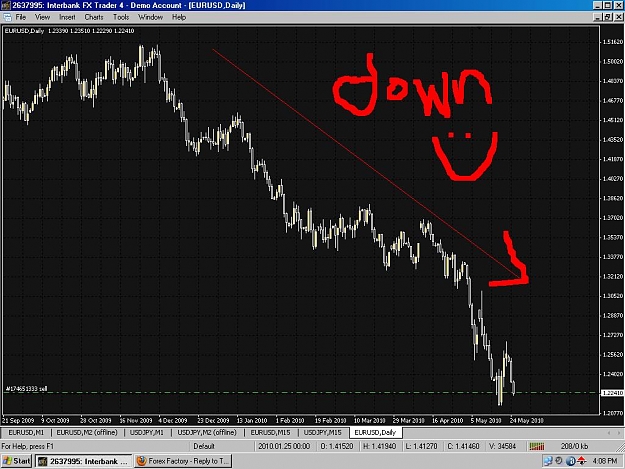
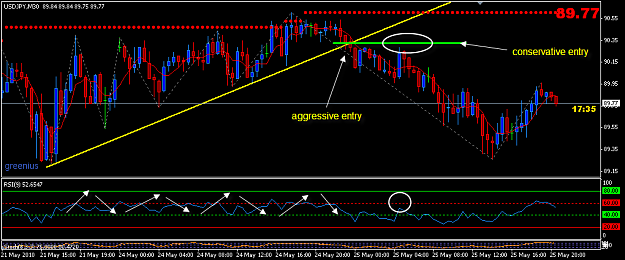
- Determine the type of trend
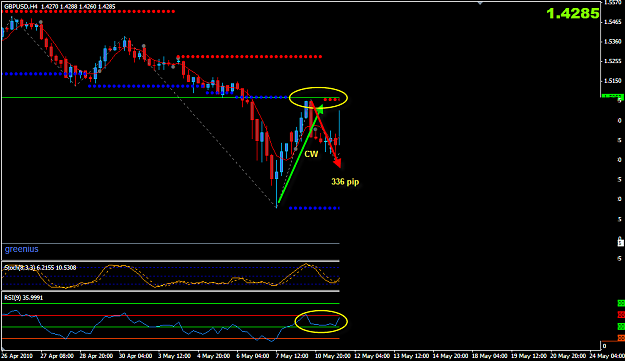
- Determination of fracture and penetration trend line
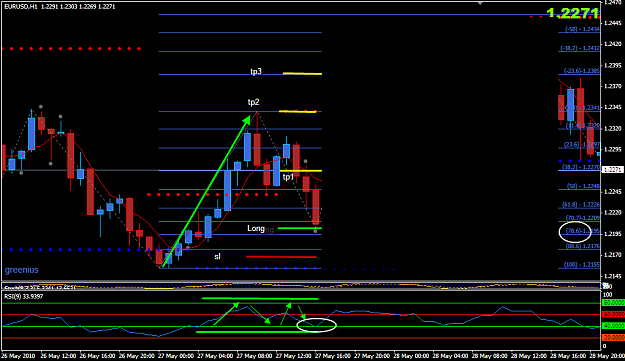
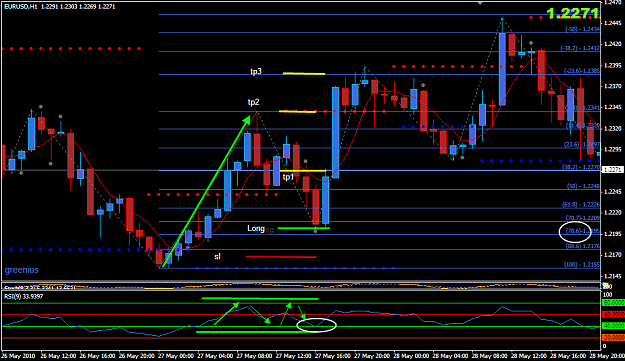
- Will we use it with harmonic
- Will determine if the break or hack true for support and resistance
- How do we use it with febo
Thanks
Greenius
Relative Strength Index (RSI) is one of the most widely used technical indicators by traders.
Benchmark index of the relative strength of the group because it is a volatile index tends to oscillate between the value of the maximum and minimum. It is used primarily to assist in determining the conditions of purchase or sale in a particular currency, as it is designed to range between 0 and 100 and determine the direction of uptrend and subsidies and resistance and breakage real and fake warning and rolling on the possibility of a change uptrend and tells you if the price in the case of fluctuate as the master of Mowhrat
If properly used as follows:
1 It is a momentum indicator and oscillate between a scale of 0-100.
2 has two basic functions to explain the price is overbought / oversold and,
3 as they determine the price movement by forming patterns, such as Double top or bottom Top, Head & Shoulders, etc., and this sort of thing myself no longer be seen, and for me I will know Benchmark
4 and will generate more references accurate market movements and trends and diavarstion
We will deal with the rsi with a new way
Will know how to take advantage of the innovative ways rsi 9
- Determine the type of trend
- Determination of fracture and penetration trend line
- Will we use it with harmonic
- Will determine if the break or hack true for support and resistance
- How do we use it with febo
Thanks
Greenius
GREENIUS