Defining a Trend
It's a common to see a trend in one time frame and going the opposite direction in another time frame. And that get many new traders confused thinking what the heck is going on?
This 'problem' can be solved by looking at multiple time frames to understand the big picture.
But then again, how do we define a higher time frame? Here's how i quantify them and aid in my understanding of the different time frames.
I have 3 time frames always and they are the long term, medium term and short term.
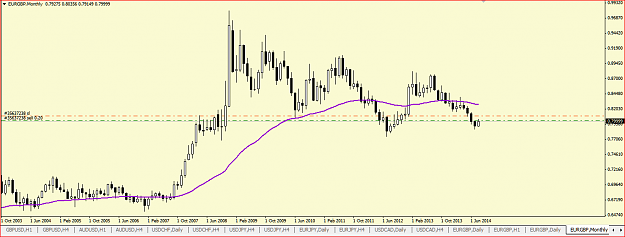
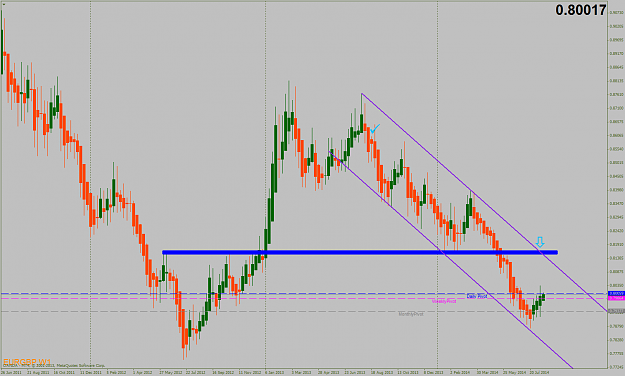
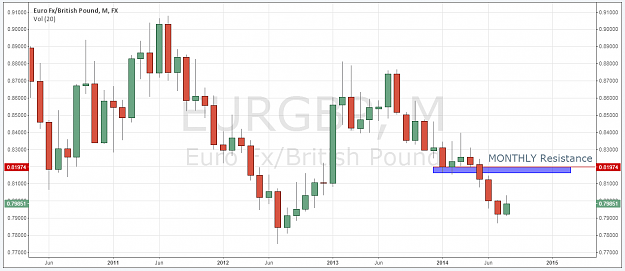
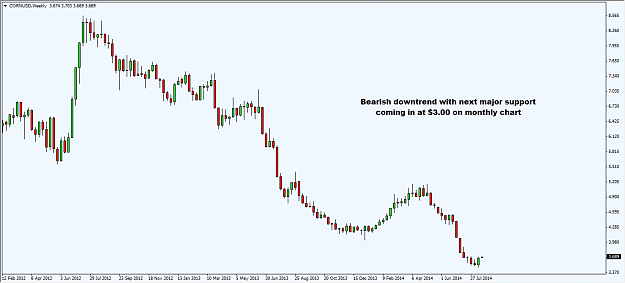
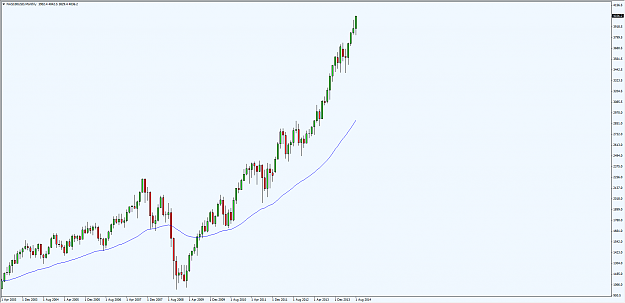
1) Long term - Here i look at what price is doing on the grand scheme of things. Basically the strongest trend of them all and likely to stay in motion for the longest period of time. I typically look at weekly or monthly chart for this.
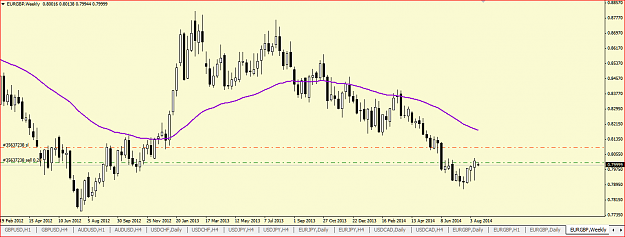
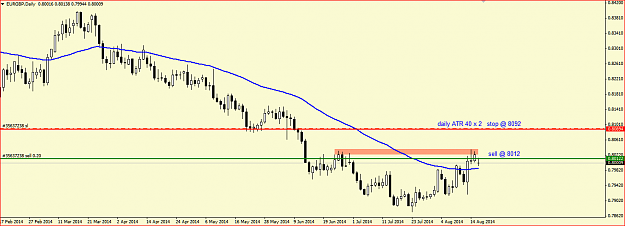
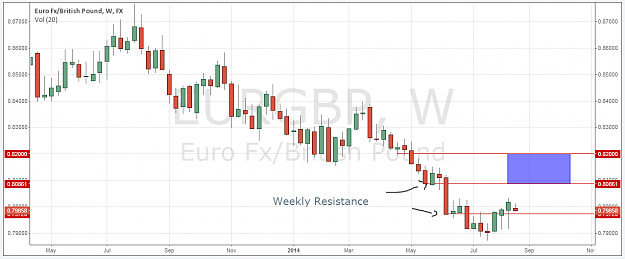
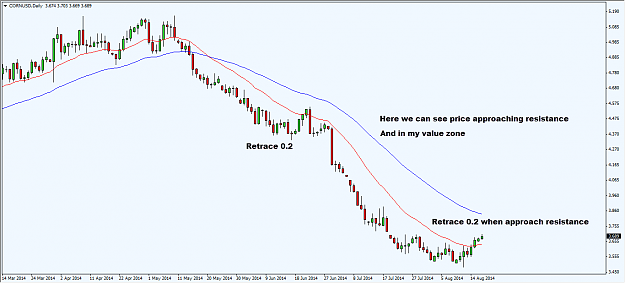
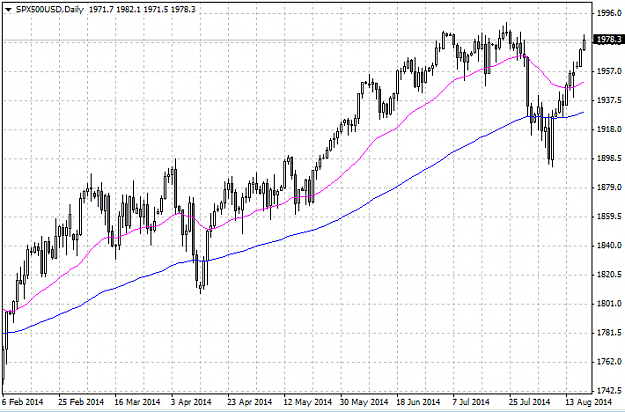
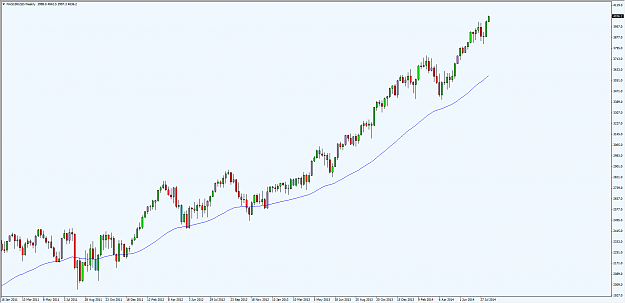
2) Medium term - Here is where i see what price is doing on the medium term. Because price could be trending higher on the longer term chart BUT doing a retracement right now. Thus this is where the medium term chart comes into play. It helps me gauge when price will resume it's long term trend. I typically look at daily or weekly chart for this.
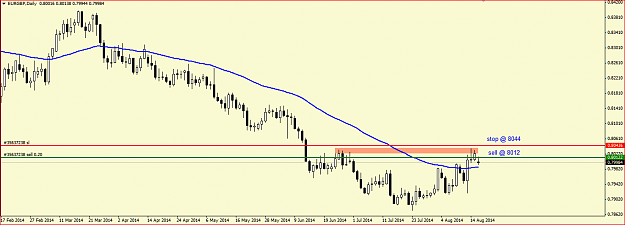
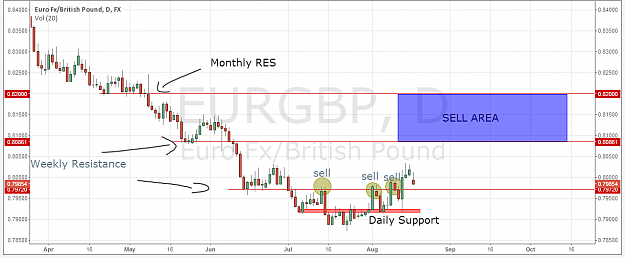
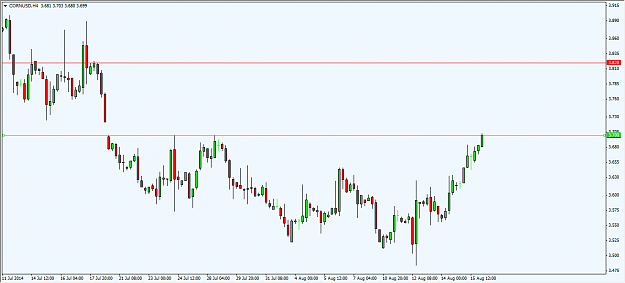
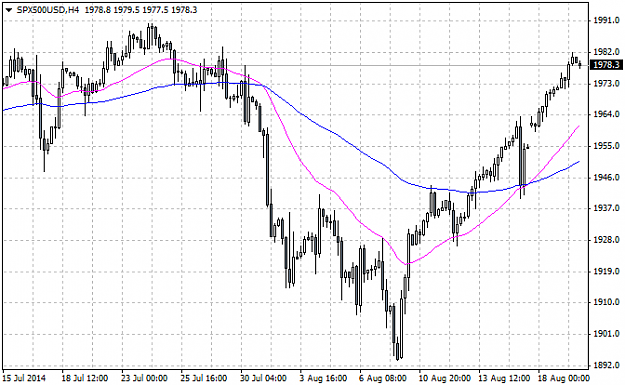
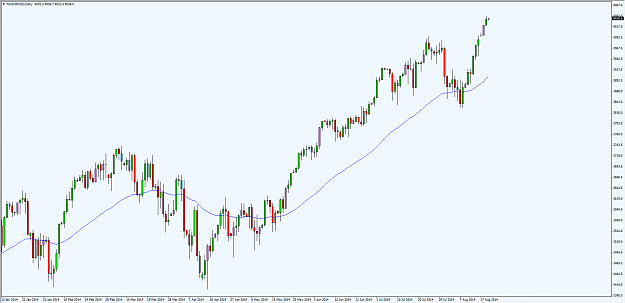
3) Short term - Here is where I look for my entries to hop onto the trend. Only if the long and medium term trend are pointing in the same direction, then i will look for trades here. If both long & medium are not in sync, i wait for better setups.
For starters, you can consider use a moving average to help filter the trend.
E.g. if price is trading above X MA on the weekly then the trend is up.
If price is trading above X MA on daily then the trend is also up.
Now that we have both pointing in the same direction, we only look for longs on our entry time frame.
Factor of 4 to 6
I tend to use a factor 4 to 6 when differentiating my long, medium and short term trend.
If my long term trend is a monthly chart, my medium term trend will be on a daily chart. 4 weeks in a month, so a factor of 4 here.
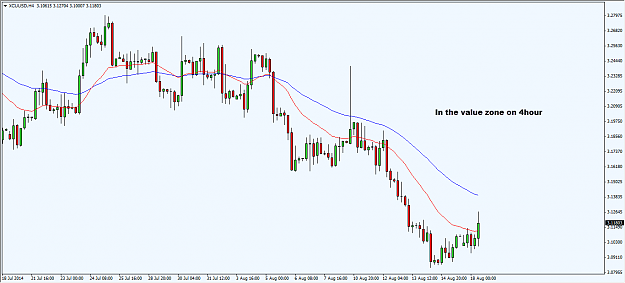
If my medium term trend is on a daily chart, my short term trend will be on a 4hour chart. We have 6 blocks of 4 hours session in a day, so a factor of 6 here.
Now basically you can play with those factors and identify your very own long, medium and short term charts. But keep it within the factor of 4 to 6 would be ideal.
Let me know if all is clear before i proceed on.
Cheers!
It's a common to see a trend in one time frame and going the opposite direction in another time frame. And that get many new traders confused thinking what the heck is going on?
This 'problem' can be solved by looking at multiple time frames to understand the big picture.
But then again, how do we define a higher time frame? Here's how i quantify them and aid in my understanding of the different time frames.
I have 3 time frames always and they are the long term, medium term and short term.
1) Long term - Here i look at what price is doing on the grand scheme of things. Basically the strongest trend of them all and likely to stay in motion for the longest period of time. I typically look at weekly or monthly chart for this.
2) Medium term - Here is where i see what price is doing on the medium term. Because price could be trending higher on the longer term chart BUT doing a retracement right now. Thus this is where the medium term chart comes into play. It helps me gauge when price will resume it's long term trend. I typically look at daily or weekly chart for this.
3) Short term - Here is where I look for my entries to hop onto the trend. Only if the long and medium term trend are pointing in the same direction, then i will look for trades here. If both long & medium are not in sync, i wait for better setups.
For starters, you can consider use a moving average to help filter the trend.
E.g. if price is trading above X MA on the weekly then the trend is up.
If price is trading above X MA on daily then the trend is also up.
Now that we have both pointing in the same direction, we only look for longs on our entry time frame.
Factor of 4 to 6
I tend to use a factor 4 to 6 when differentiating my long, medium and short term trend.
If my long term trend is a monthly chart, my medium term trend will be on a daily chart. 4 weeks in a month, so a factor of 4 here.
If my medium term trend is on a daily chart, my short term trend will be on a 4hour chart. We have 6 blocks of 4 hours session in a day, so a factor of 6 here.
Now basically you can play with those factors and identify your very own long, medium and short term charts. But keep it within the factor of 4 to 6 would be ideal.
Let me know if all is clear before i proceed on.
Cheers!
Whether you can or you can't, you are both right.