The technical analysis approach bases the trading strategies on past price behavior with the assumption that patterns of movement will repeat. One of the main problems with technical analysis is the difficulty of specifying the patterns in a manner that permits objective testing. If I post a question like "What is a bullish flag?" I will have answers like "that doesn't work", with no additional explanations. Or "go and read babypips" where I won't find any intelligent answer. After I will receive tons of charts where a bullish flag was present and worked thanks to the hindsight. How to properly, objectively define a bullish flag won't be explained. I will read posts explaining that it is subjective almost like an art: no more than an excuse to not admit the ignorance. If an up trend is made of higher highs and higher lows, what is a high? What is a low? Why? If a hammer has a small body what is small enough to be small? Why?
The quantitative analysis approach bases the strategies on mathematical models of the price evolution.
One of the problems with quantitative analysis is the definition of the model which is applied. The model has to be trusted as valid. Then the parameters have to be estimated which will make their values either inacurate or lagged or both.
What about quantifying the TA itself as being the model to estimate?
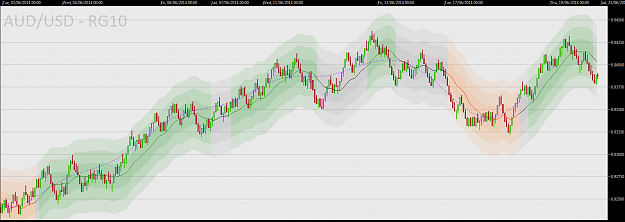
As an example, I spent a long time to estimate the trend. I had to answer "what is a trend?". I found an answer that mostly satisfies me. Not because it is correct. Not because it is elegant. But because it is the best I can objectively define and I think there is no correct answer anyway. At least I have a definition. Looking at my resulting indicator I thought that there was something missing: the ranges. More precisely the definition of the ranges. At first I simply thought that a range is no more than a special case of a trend. It isn't an up trend or a down trend but a horizontal trend. After all a horizontal line is a line like the others, isn't it?
But there is a difference between a range and a trend. In an up trend going short has less probability of success and a smaller potential profit compared to going long. Conversly for the down trend. This is obvious because the retracements are smaller than the forward moves. But a range can be traded both side with equal risk and potential profit. How small shall be the slope of the trend to be a qualified a range? In fact wide ranges are made of swings which are at the limit of the trend in term of bandwidth. It may happen that the estimated slope of the trend inside a range gets greater than the slope of a steady trend! There is no threshold below which a trend can be qualified a range!
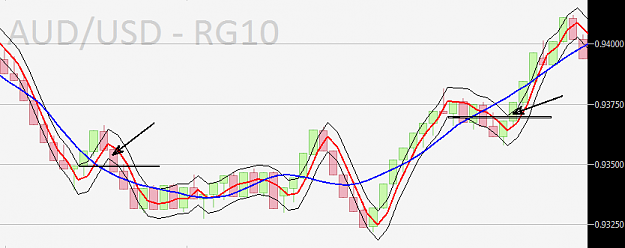
To improve the trend estimation I realized that the trend lines and channels were actually quite good tools. Are they really improving the result or is it just coming from my beliefs? How to draw them automatically to validate this?
Can I match a bullish flag, a hammer, a S/R level, a trend line... objectively? People like Lo, Mamaysky, Osler and Wang have scratch the paint in the academical research field.
I wonder if there are people here interested in discussing these problems. Those are extremely hard problems to solve. They involve complex mathematics tools. I don't expect a lot of people posting here but I wish valuable posts.
The quantitative analysis approach bases the strategies on mathematical models of the price evolution.
One of the problems with quantitative analysis is the definition of the model which is applied. The model has to be trusted as valid. Then the parameters have to be estimated which will make their values either inacurate or lagged or both.
What about quantifying the TA itself as being the model to estimate?
As an example, I spent a long time to estimate the trend. I had to answer "what is a trend?". I found an answer that mostly satisfies me. Not because it is correct. Not because it is elegant. But because it is the best I can objectively define and I think there is no correct answer anyway. At least I have a definition. Looking at my resulting indicator I thought that there was something missing: the ranges. More precisely the definition of the ranges. At first I simply thought that a range is no more than a special case of a trend. It isn't an up trend or a down trend but a horizontal trend. After all a horizontal line is a line like the others, isn't it?
But there is a difference between a range and a trend. In an up trend going short has less probability of success and a smaller potential profit compared to going long. Conversly for the down trend. This is obvious because the retracements are smaller than the forward moves. But a range can be traded both side with equal risk and potential profit. How small shall be the slope of the trend to be a qualified a range? In fact wide ranges are made of swings which are at the limit of the trend in term of bandwidth. It may happen that the estimated slope of the trend inside a range gets greater than the slope of a steady trend! There is no threshold below which a trend can be qualified a range!
To improve the trend estimation I realized that the trend lines and channels were actually quite good tools. Are they really improving the result or is it just coming from my beliefs? How to draw them automatically to validate this?
Can I match a bullish flag, a hammer, a S/R level, a trend line... objectively? People like Lo, Mamaysky, Osler and Wang have scratch the paint in the academical research field.
I wonder if there are people here interested in discussing these problems. Those are extremely hard problems to solve. They involve complex mathematics tools. I don't expect a lot of people posting here but I wish valuable posts.
No greed. No fear. Just maths.