See guy the way I have understood trading VSA is simple and straight to the point. I think that effort versus result is one important information we have to understand as VSA traders.
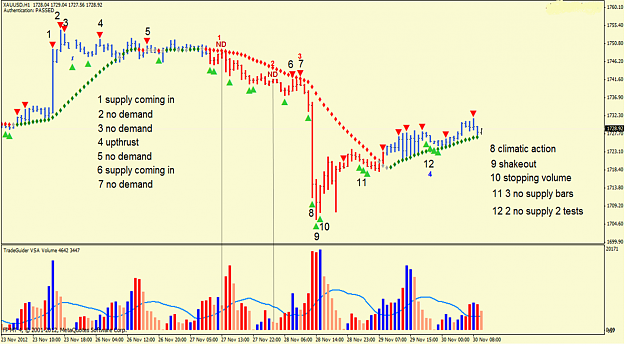
TG has labelled:
#2 as no demand but here thew vol is above avg and the bar has a wider spread ,its more like UT
# 4 as upthurst- should it not be ND because the bar is narrow and vol is less than 2 prev
#7 this is labelled as UT when the high seems lower than prev bar and is narrow i think ND is a better description
However there is weakness after the climatic up bar and the ranges narrowing and once we see red diamonds appearing then short could be taken.But personally i dont like TG painting over the bars as i feel this removes the details we need to see bar to bar.
This is where software falls down. There are no reliable VSA based entries here. Sure there are signs to be read but, how you interpret the chart is all important.
In this instance, yes it works but, there are a great many times it doesn't. Also, bar 9 closes in the lower half of the bar. That is not a SO, it's just a down bar. Bar 10 they have labelled stopping volume. What has it stopped exactly? Price didn't move far on the previous bar (which had almost as much volume as this one). In fact it was the volume on the previous bar that did all...
Ignored
BTW gez, my comments are based squarely at the software, NOT you
BTW gez, my comments are based squarely at the software, NOT you
Ignored
I agree with Intel; but we need to be highly critical of our views so we can really get the best out of our VSA principle/methodology we have adopted so as to become more profitable in forex. We are hear to help and support each other.
Nice to see some life here again... Intel it's great to have you back in the mix, you have been missed.
So as not to be left out of the cool kids party I am sharing a few random thoughts on using my daily chart. No point in particular but I am a big beleiver that VSA works no matter the TF. You just need to figure out how it works for you to suit your plan and MM style. I love HG's saying that we need to see what we want to see, where we want to see it.
For me the where is easy. I use VZA (volume zone analysis for those that aren't familair...
Ignored
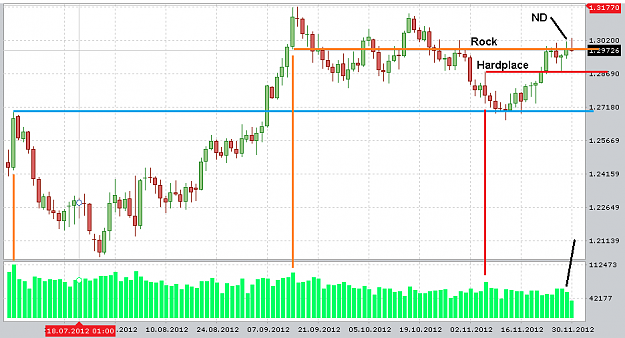
Follow up with today's view of the EU daily chart.
ROCK is holding up well thus far as a supply / resistance level.
Today is Friday and the last day of November so whatever is brewing we will most likely not see the results until next week. Perhaps another visit first to the HARDPLACE and then perhaps back down to the blue line...
Time will tell.
This whole trading week we have made little progress either way and have been very much rangebound... hopefully next week we will get a break and a little better weekly range.
Ignored
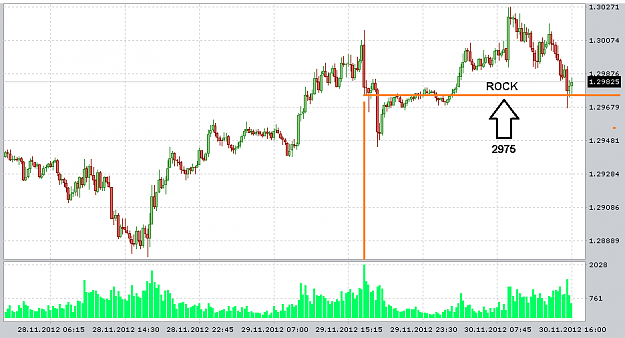
Now my intraday picture 15min chart shows some great volume at volume. Yesterday highest volume 15min bars low is... drumroll please....
2975 - this is the ROCK level - September 14th daily low
We pushed back above this level today made a new weekly high and then came back down to test this level again on some increased volume.
Has demand taken over this level or is SM absorbing the demand that has set up a small camp here? Demand at this level is to be expected the question is...
Are SM with or against the demand. That is what we must determine so we align ourselves with the right side. Don't worry though SM will show us their side... they will expose their hand.
Good bail, I have entered long and will hold for new monthly highs.
Ignored
Stil holding long positions for a .3060 test. What i currently like seeing is negative news rally's. this is a great time to watch for supply to be gobbled up by large orders. Watch for the drop on high volume follwed by tight spread high volume bars clossing on their highs on 15 min to 1 hour timeframes. ill post an example when i get off this loud train commuter!
One thing that made me smile when I had TG was its retrospective indicator marking. I can almost guarantee that the shakeout indicator was placed on the bar after the second part of the shakeout printed, possibly even after the bar after that printed.
Ignored
"had", you don`t anymore?
Seek not to change the world; seek only to change your mind about the world
Seeing your posting again can you answer this for me, once a down move is under way with weakness in the background, we often see demand coming in, GH said this is professional money supporting a falling market, why would they do this if the market is weak? surely they`ll be losing money by doing this.
Gez
Seek not to change the world; seek only to change your mind about the world
......... once a down move is under way with weakness in the background, we often see demand coming in, GH said this is professional money supporting a falling market, why would they do this if the market is weak? surely they`ll be losing money by doing this.
Gez
Ignored
As Buzz Lightyear finally admitted "...falling with style".
It's all about control, they don't want to risk a run away train.
Just looking at this chart, There appears to be at least three (3) short entries and then a couple of long entries. The three (3) short entries are marked in red and what I want to make a point about.
Like Intel said, the software has limitations.
If you are waiting around for a signal to get short, then you get short at 3 which is marked with a 7.
But let's step back for a second and understand the underlying principles of the method GH teaches. To get short, one should be looking for signs of weakness in a down trend. Said signs of weakness, usually come on UP bars. And the most often one of these signs will be a No Demand. So for now we will disregard things like failed tests and narrow range up bars with increasing volume (squats).
There appears to be two (2) No Demand entries prior to entry 3. The most important thing being that TG does not place signals on them. Does that mean they are not narrow range up bars on volume less than the previous two intervals? Or does that mean the user still has to be able to identify strength and weakness on his own to get the most out of the software?
I believe it's the latter and not the former. If it's the former, then that is basically saying "If TG does not recognize it, it does not exist". Even Gavin and Tom don't make that claim.
Attached Image (click to enlarge)
Wyckoff VSA: (1) Supply & Demand (2) Effort vs. Result (3) Cause & Effect
Seeing your posting again can you answer this for me, once a down move is under way with weakness in the background, we often see demand coming in, GH said this is professional money supporting a falling market, why would they do this if the market is weak? surely they`ll be losing money by doing this.
Gez
Ignored
Sorry for interrupting your conversation, but can't hold myself from posting.
As I see this situation. At each point of time SM are willing to test current supply/demand. As I know SM don't know at what price they will stop accumulating and will push price higher. They know where the market will go, with the most probability (as they have levers of control and THEY are making process of accumulation and distribution)but they don't know when sellers (herd) will end their ability to sell. SM are not psychics.
SM need to control the market. They need to make HH, LL, LH,HL etc. with the help of a crowd. By drawing the picture of the market price, they need to support the market. Sometimes they are accumulating some contracts when price going down, sometimes they are willing to test the market, sometimes just to support. All depends on a current market position.
Well, I have it, but I don't use it any more. eSignal was costing too much and I wasn't making enough (anything) to pay for it. Not to mention various other shortfallings of the software.
Seeing your posting again can you answer this for me, once a down move is under way with weakness in the background, we often see demand coming in, GH said this is professional money supporting a falling market, why would they do this if the market is weak? surely they`ll be losing money by doing this.
Gez
Ignored
A couple of good answers already
There are several reasons for demand entering in a down move however, some times there is no demand entering at all. It just looks like it because price is rising.
In no particular order:-
1 SM do want to control the move.
2 We use the term 'SM' to describe an entity who moves the market at will. In fact, SM are made up of many groups of traders, some of which may want to stop the move. They will try to buy up the stock so it stops dropping. If they fail, price will stall for a while before it continues to fall.
3 SM operate not only for themselves but on behalf of lots of clients. These clients may give instructions to buy and sell at specific prices. SM will buy as instructed even if they don't want it.
4 There are 'Market Makers' out there who have an obligation to complete trades(sell to and buy from independed traders), it may be that a lot of buy orders have been hit which temporarily stall the price drop. SM will test the market to see how much demand there is.
5 In order for price to fall, there has to be more sellers than buyers. If SM flood the market with sell orders, price will drop quickly. If they stop selling, there will suddenly be more buyers than sellers so price will start to rise again. SM can judge how much demand is out there by how willing the buyers are, to pay more for the stock. If there is not much demand about, they can flood the market with sell orders again to soak up the buyers thus allowing the price to drop again. If there is a lot of demand around, SM will let them buy themselves out until such time that the demand has been satisfied. Then they will flood the market.
6 Then there is the trap move. SM might stall the drop in order to bring the buyers out. Make them believe that price is about to rise so they buy like mad, allowing the SM to offload and continue to flood the market with sell orders. A couple of pages ago I made a comment about one of HGs charts I think. We were looking for a ND in a falling market so we could enter but, we saw some high volume just before the drop continued. I said that we often see this scenario. This is the trap move I've just described. The high volume seen is the SM flooding the market with sell orders initially matching all of they buyers before they dry up. Then price falls generally quite quickly.
A couple of good answers already
There are several reasons for demand entering in a down move however, some times there is no demand entering at all. It just looks like it because price is rising.
In no particular order:-
1 SM do want to control the move.
2 We use the term 'SM' to describe an entity who moves the market at will. In fact, SM are made up of many groups of traders, some of which may want to stop the move. They will try to buy up the stock so it stops dropping. If they fail, price will stall for a while before it continues...
Ignored
What can I say? Another brillant post. Thanks.
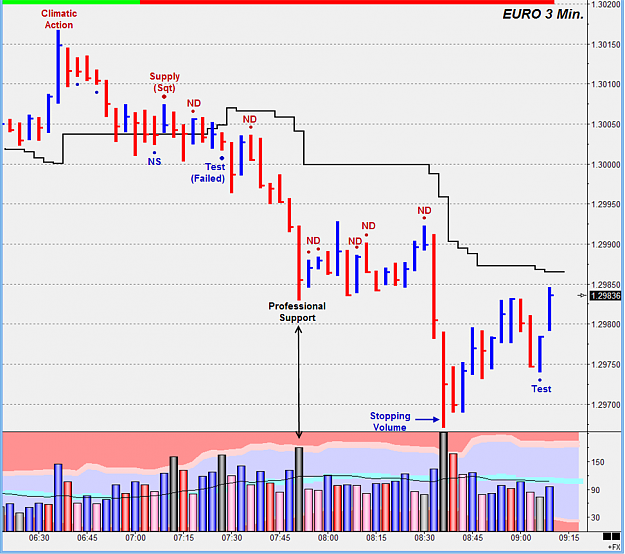
I have attached a chart of today showing some professional (SM) support during a down trend.
Attached Image (click to enlarge)
Wyckoff VSA: (1) Supply & Demand (2) Effort vs. Result (3) Cause & Effect
I have attached a chart of today showing some professional (SM) support during a down trend.
Ignored
There's a point i'd like to make about this chart and in support of multiple time frame usage. I know HG and Intel aren't great supporters of it, but hear me out!
At the bottom you marked some stopping volume, which is fine, i'm sure we can all see this. What's interesting to me is that the next bar is down. This may confuse people as we often look for the next bar to be up to "confirm" that this was in fact buying. The down bar does have healthy volume on it as well and it looks to be buying over two bars. This kind of concept confused me to start with as I was looking for it to happen over two bars. The lower time frames can some times clutter this so I found it was good to have another time frame at least double or three times the one you're already using. It helped me to see it a bit clearer to begin with. If you look at the 15min from Friday you'll see what I mean, stopping volume then several up bars confirming buying before the push up to 1.3000 again.
There's a point i'd like to make about this chart and in support of multiple time frame usage. I know HG and Intel aren't great supporters of it, but hear me out!
At the bottom you marked some stopping volume, which is fine, i'm sure we can all see this. What's interesting to me is that the next bar is down. This may confuse people as we often look for the next bar to be up to "confirm" that this was in fact buying. The down bar does have healthy volume on it as well and it looks to be buying over two bars. This kind of concept confused me to...
Ignored
You make a good point here. I would like to pick you up on one point tho, I am a huge fan of multi TF analysis. I look at the whole range of TFs every time I trade. Mostly to confirm or refute my GENERAL market analysis. I will also trade them if I see a vald setup. However, M5 and M15 are my TFs of choice.
Where I may differ from some is, if I see a valid setup on one TF, I will take it no matter what the other TFs say. This may not be right for everyone, it's just how my trading style/method has evolved. Lets not forget, I'm only in trades for 2-4 bars normally. Most are in for much longer than that therefore, they may need to pay much more attention to higher TFs.
BTW the red lines you saw on my chart the other day (that some were summising might be S&R) are trend channels drawn from the D1 chart!