Questions about stop loss. I was reading a little in ff and hit up on that topic again. Let me come up with an interesting fact about it.
Here is the experiment: You are trading with a take profit of 20 pips. You want to know the probability of being stopped out when your stop loss is 1 pip. Believing Laplace it is
P (SL) = SL / (TP + SL) = 95 %
Spoon-fed: Stop loss in pips divided by the sum of take profit in pips and stop loss in pips equals the ratio of hitting the stop. If your stop loss is 1 pip and your take profit is 20 pips than it is likely about 95% that you are being stopped out.
Now lets calculate the ratio for every combination of stop loss and take profit from 1/20, 2/20, , 20/20 and plot it on a chart.
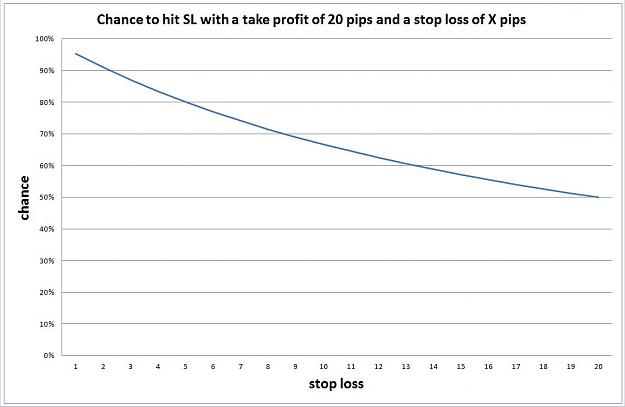
The chance of being stopped out is decreasing with a growing stop loss. The bigger the stop loss the better it is? I dunno for sure as I blow up more than one account using no stop loss at all ...
...
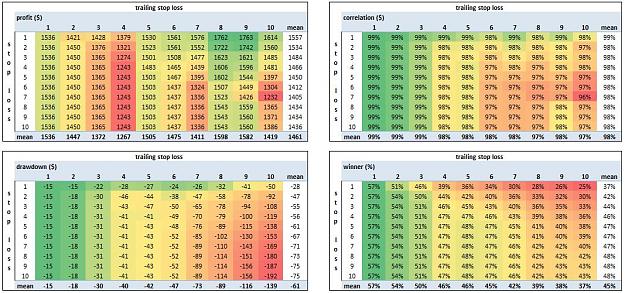
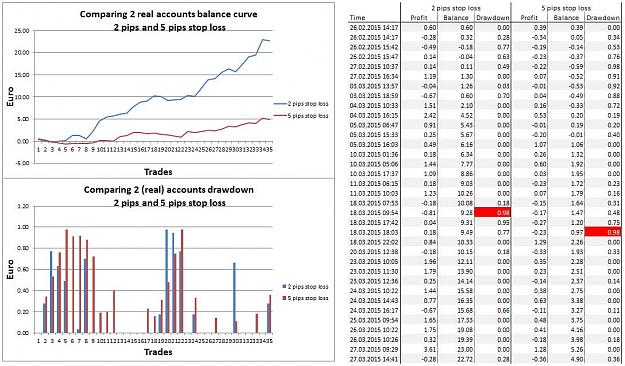
Step two of the experiment: It will show a really good reason not only to trade with a stop loss but to trade with a stop loss as small as possible. Assuming you have a strategy that is only somewhat slightly profitable. You should have, otherwise I see no reason at all of taking part at this game. In case you have, the relationship between the drawdown of your account and the size of your stop loss is as follows:
The smaller your stop loss is the smaller is your drawdown as well. Although a small stop loss means to be stopped out quite more frequently.
I try to proof that relationship with a neutral approach. That means I am not relying on my own or someone elses trading experience but on an experimental estimation.
I wrote an algorithm that is carrying out 1000 trades by chance. It is doing that until it has a result that is at least a bit profitable. In the next step the drawdown of those 1000 trades is calculated. The procedure is done for every combination of stop loss and take profit from 1/20, 2/20, ... , 20/20 and the draw down is plot on a chart:
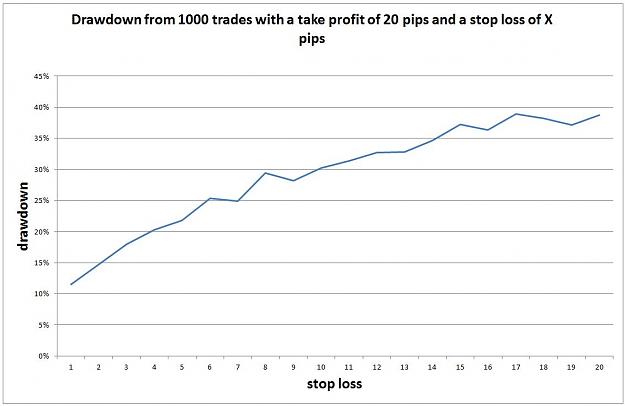
That is probably the reason why you have heard so often to cut your losses short.
Some details about the estimation:
The initial account balance is 1000 USD. The volume is 0.1 lot. For every combination of stop loss and take profit the calculation is done 100 times. The values plotted are the averages of each 100 calculations.
Here is the experiment: You are trading with a take profit of 20 pips. You want to know the probability of being stopped out when your stop loss is 1 pip. Believing Laplace it is
P (SL) = SL / (TP + SL) = 95 %
Spoon-fed: Stop loss in pips divided by the sum of take profit in pips and stop loss in pips equals the ratio of hitting the stop. If your stop loss is 1 pip and your take profit is 20 pips than it is likely about 95% that you are being stopped out.
Now lets calculate the ratio for every combination of stop loss and take profit from 1/20, 2/20, , 20/20 and plot it on a chart.
Attached Image (click to enlarge)
The chance of being stopped out is decreasing with a growing stop loss. The bigger the stop loss the better it is? I dunno for sure as I blow up more than one account using no stop loss at all
Step two of the experiment: It will show a really good reason not only to trade with a stop loss but to trade with a stop loss as small as possible. Assuming you have a strategy that is only somewhat slightly profitable. You should have, otherwise I see no reason at all of taking part at this game. In case you have, the relationship between the drawdown of your account and the size of your stop loss is as follows:
The smaller your stop loss is the smaller is your drawdown as well. Although a small stop loss means to be stopped out quite more frequently.
I try to proof that relationship with a neutral approach. That means I am not relying on my own or someone elses trading experience but on an experimental estimation.
I wrote an algorithm that is carrying out 1000 trades by chance. It is doing that until it has a result that is at least a bit profitable. In the next step the drawdown of those 1000 trades is calculated. The procedure is done for every combination of stop loss and take profit from 1/20, 2/20, ... , 20/20 and the draw down is plot on a chart:
Attached Image (click to enlarge)
That is probably the reason why you have heard so often to cut your losses short.
Some details about the estimation:
The initial account balance is 1000 USD. The volume is 0.1 lot. For every combination of stop loss and take profit the calculation is done 100 times. The values plotted are the averages of each 100 calculations.