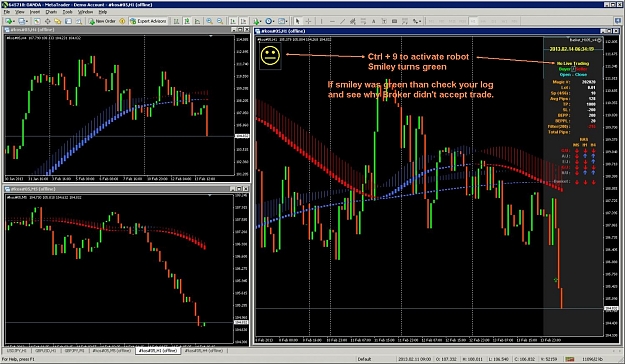
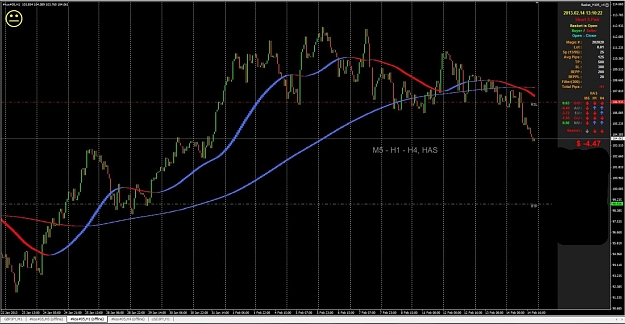
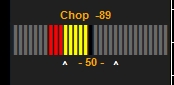
I am presently working on a different approach to a Chop or Range filter, shown below will be what it will look like. You will be able to set the amount of chop you will tolerate before taking a trade, this is something I will need to gather data on to come up with a good number to use here.
I will need a few weeks to test it as I need to gather data and for that I need a market going through various phases, I will then graph the Chop Number and compare it to the actual PA and see if there is any confluence.
If it works good it may replace the pip filter.
It will not be able to catch the entry to chop, as I don't think anyone can do that, but once the chop is started it should keep you out of trades until the chop is cleared.
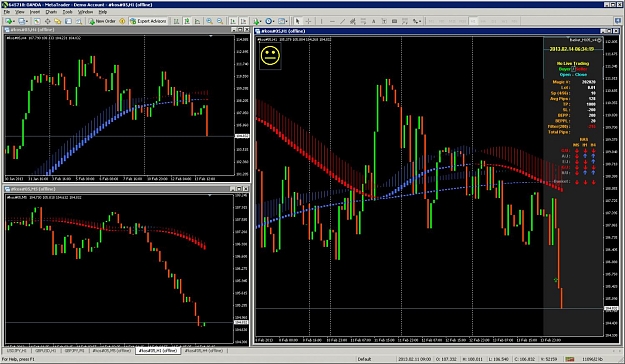
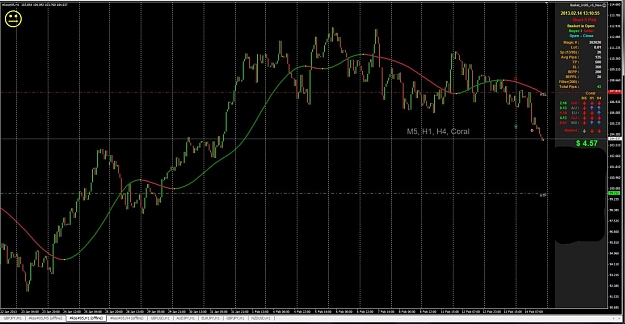
The bar graph will show red to the left if the PA has a downward bias chop and green to the right if the PA has a upward bias chop. It will show yellow when it is within your no trade chop range you have set, in this case it was +-50 pips. So you can see we are outside the chop range with a down side side bias with 2 red bars, the chop reading at this time is -89 (below -50), as shown on the top of the graph.
I will need a few weeks to test it as I need to gather data and for that I need a market going through various phases, I will then graph the Chop Number and compare it to the actual PA and see if there is any confluence.
If it works good it may replace the pip filter.
It will not be able to catch the entry to chop, as I don't think anyone can do that, but once the chop is started it should keep you out of trades until the chop is cleared.
The bar graph will show red to the left if the PA has a downward bias chop and green to the right if the PA has a upward bias chop. It will show yellow when it is within your no trade chop range you have set, in this case it was +-50 pips. So you can see we are outside the chop range with a down side side bias with 2 red bars, the chop reading at this time is -89 (below -50), as shown on the top of the graph.
Attached Image