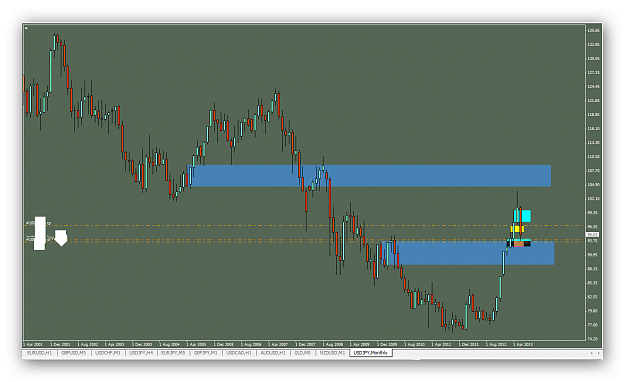
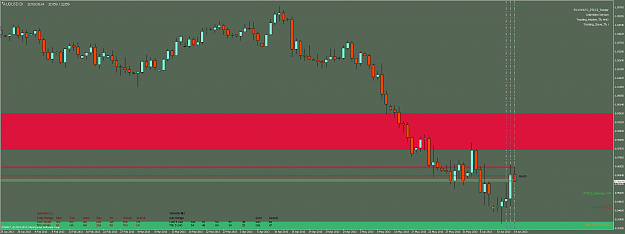
AUDUSD MN:
When Price was falling last month, this picture helped me realise that the reverse to Bulls
might not take place just yet, when there was a Bullish retrace of over 100 Pips about a week ago or so.
I saw the floor was still lower, and Price did go so far!
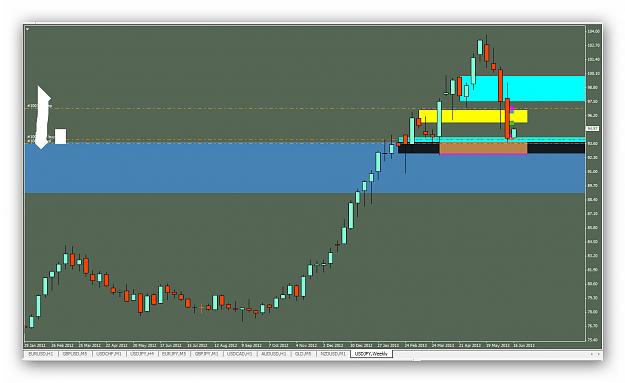
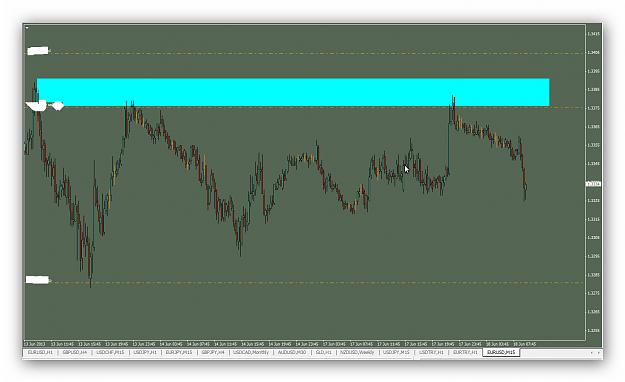
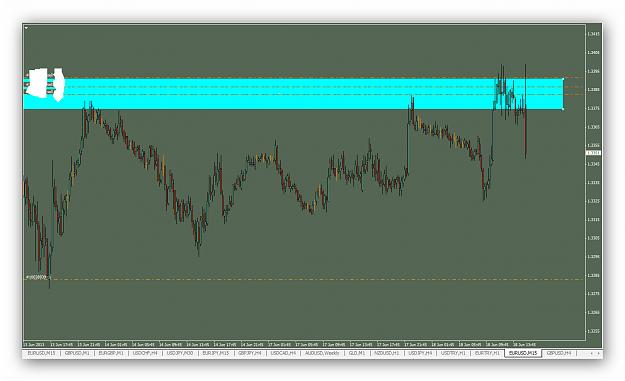
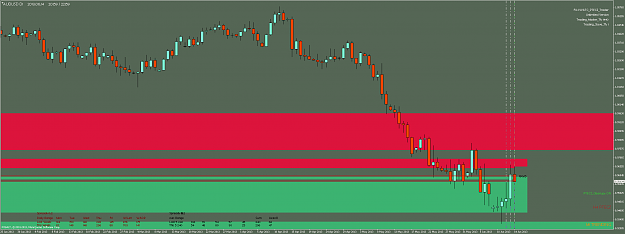
AUDUSD W1:
The weekly chart helps me to find those levels even more precisely.
I do not look at concrete Prices, just the Candlesticks.
And I plot the PTECZ from High to Low of the PTECZ Candle.
As I plot the PTECZs, I already get information about the Global Position of the Price.
On the MN I see that even though it is mid of month, the Price is obviously in Consolidation,
being rejected from both Top and Bottom.
On the W1 I see that more clearly in the context of this month's Weekly Candles.
I see the Bullish retrace which eventually ended as strong Bearish week with a Top rejection CSCZ.
Unless there is no surprise at Market Open, last week looks like a W1 current PTECZ.
As Day Trader, I need to see more closely.
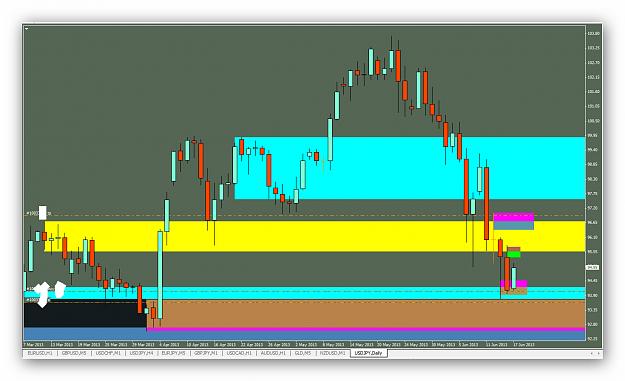
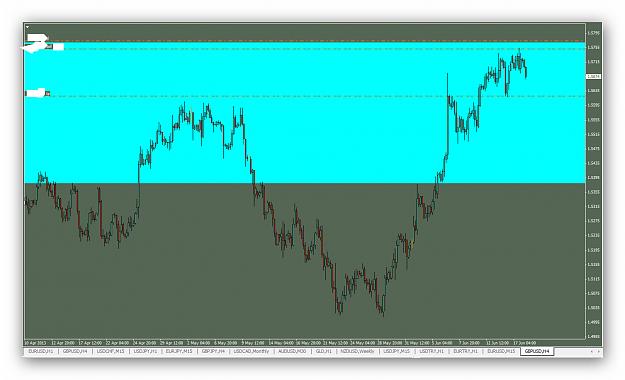
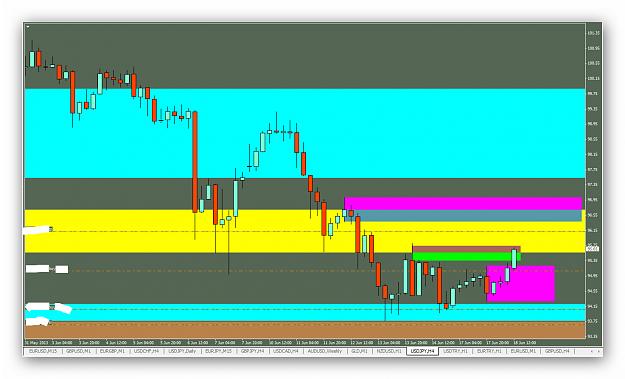
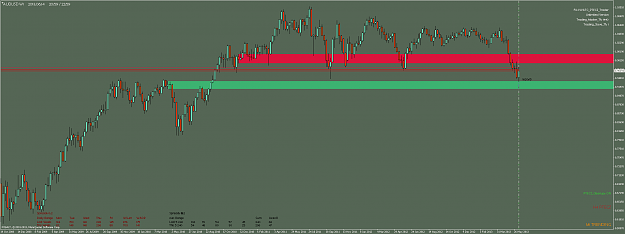
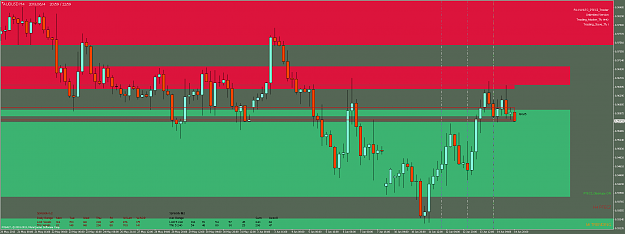
AUDUSD D1:
In the context of W1 PTECZs (ca. 420 Pips) I see the Daily Price Action in more detail.
Now, even the PTECZ_Trader functions come in handy - the Red Master_CSCZ and Green Master_CSCZ.
Following the Red Master_CSCZ I can find the relevant historical PTECZ.
Following the Green Master_CSCZ I can find the relevant historical PTECZ.
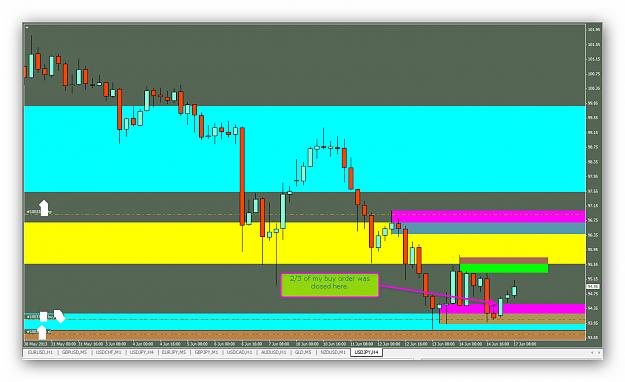
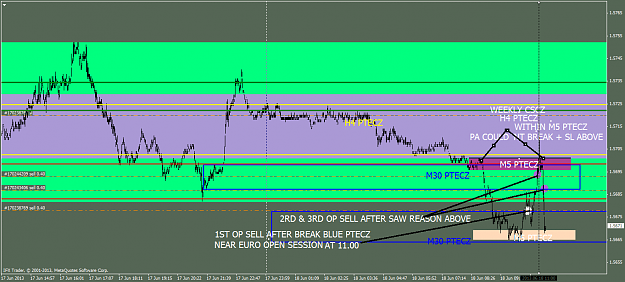
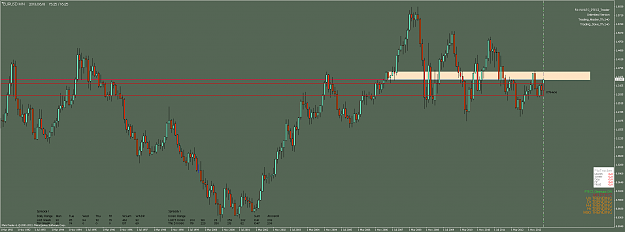
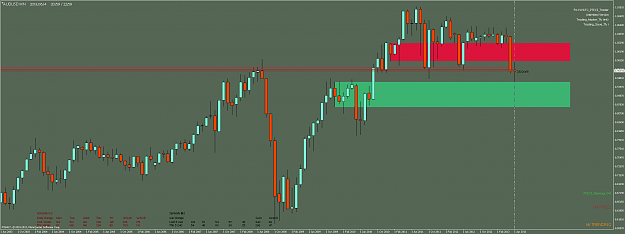
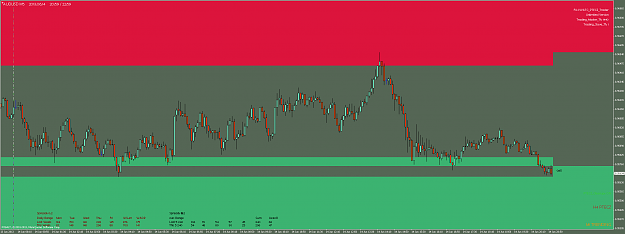
AUDUSD H4:
Switching to H4 I see the picture in the historical PTECZs contexts.
This can help me optimise the more precise Trading context as I see the PTECZ and I can now find the H4 PTECZs.
Let's suppose we were at Friday morning analysing for the Day.
We would actually already have the Ceiling PTECZ.
We would optimise the Floor PTECZ to the ADR, about 100 Pips.
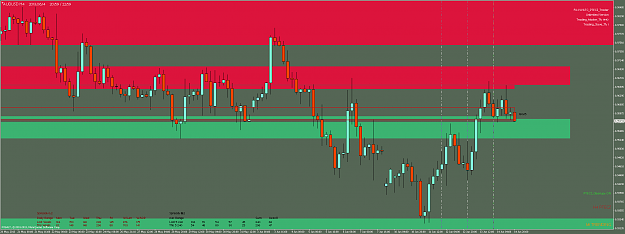
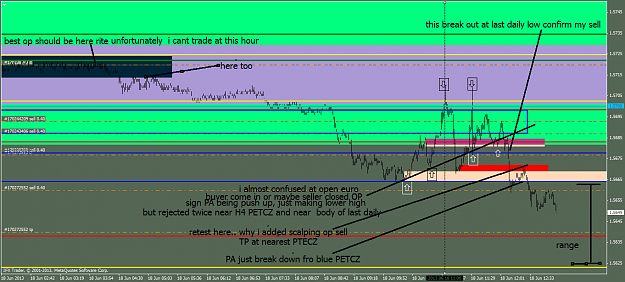
Of course, we are reading Price Action all the time!
We know the Trend has been Bullish for the last 3 days, with retraces ending at Higher Lows.
So, we watch Price Action and Trade of the M5 for example:
There are thousands of little details as we Trade.
I can not describe in a post the whole thinking process that goes on in real time.
That is impossible.
You see how lengthy it gets even to describe a small fragment, not to mention the whole day.
There are 288 M5 Candles in 1 Day.
There are 1440 M1 Candles in 1 Day.
There are 10080 M1 Candles in 1 Week.
There are 43200 M1 Candles in 1 Month.
I don't think anyone could follow such a written description, anyhow.
That is what the picture is for, the picture, not concrete Price Values.
I think I have noted that out somewhere?
I do not know what the "correct" Price is!
I do not know what Price is Low Enough or High Enough!
I do not care, that is just another Bias!
Thus, I do not even need to see the Price Line, I set the Grid color to None.
I Trade the Picture, not the Price.
I Trade Price Action on the Picture, not Price Values!
Attached Image (click to enlarge)
When Price was falling last month, this picture helped me realise that the reverse to Bulls
might not take place just yet, when there was a Bullish retrace of over 100 Pips about a week ago or so.
I saw the floor was still lower, and Price did go so far!
AUDUSD W1:
Attached Image (click to enlarge)
The weekly chart helps me to find those levels even more precisely.
I do not look at concrete Prices, just the Candlesticks.
And I plot the PTECZ from High to Low of the PTECZ Candle.
As I plot the PTECZs, I already get information about the Global Position of the Price.
On the MN I see that even though it is mid of month, the Price is obviously in Consolidation,
being rejected from both Top and Bottom.
On the W1 I see that more clearly in the context of this month's Weekly Candles.
I see the Bullish retrace which eventually ended as strong Bearish week with a Top rejection CSCZ.
Unless there is no surprise at Market Open, last week looks like a W1 current PTECZ.
As Day Trader, I need to see more closely.
AUDUSD D1:
Attached Image (click to enlarge)
In the context of W1 PTECZs (ca. 420 Pips) I see the Daily Price Action in more detail.
Now, even the PTECZ_Trader functions come in handy - the Red Master_CSCZ and Green Master_CSCZ.
Following the Red Master_CSCZ I can find the relevant historical PTECZ.
Following the Green Master_CSCZ I can find the relevant historical PTECZ.
Attached Image (click to enlarge)
AUDUSD H4:
Switching to H4 I see the picture in the historical PTECZs contexts.
Attached Image (click to enlarge)
This can help me optimise the more precise Trading context as I see the PTECZ and I can now find the H4 PTECZs.
Let's suppose we were at Friday morning analysing for the Day.
We would actually already have the Ceiling PTECZ.
We would optimise the Floor PTECZ to the ADR, about 100 Pips.
Attached Image (click to enlarge)
Of course, we are reading Price Action all the time!
We know the Trend has been Bullish for the last 3 days, with retraces ending at Higher Lows.
So, we watch Price Action and Trade of the M5 for example:
Attached Image (click to enlarge)
There are thousands of little details as we Trade.
I can not describe in a post the whole thinking process that goes on in real time.
That is impossible.
You see how lengthy it gets even to describe a small fragment, not to mention the whole day.
There are 288 M5 Candles in 1 Day.
There are 1440 M1 Candles in 1 Day.
There are 10080 M1 Candles in 1 Week.
There are 43200 M1 Candles in 1 Month.
I don't think anyone could follow such a written description, anyhow.
That is what the picture is for, the picture, not concrete Price Values.
I think I have noted that out somewhere?
I do not know what the "correct" Price is!
I do not know what Price is Low Enough or High Enough!
I do not care, that is just another Bias!
Thus, I do not even need to see the Price Line, I set the Grid color to None.
I Trade the Picture, not the Price.
I Trade Price Action on the Picture, not Price Values!
Trade the facts, not opinions.