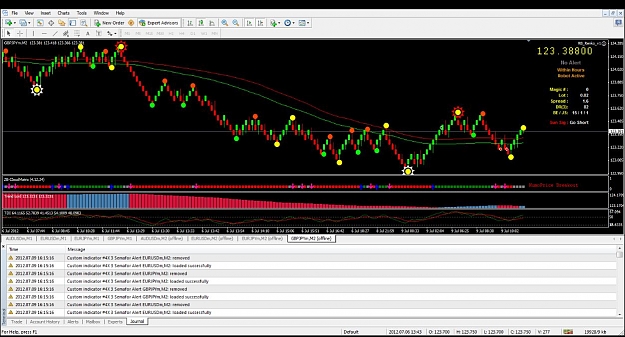
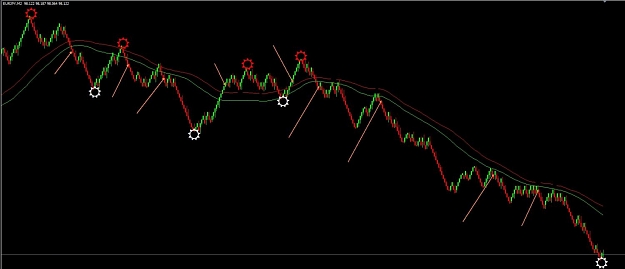
Below is a chart showing possible entry points the EA would have taken, they probably all would have made some pips depending of course on your TP and SL settings, don't get greedy.
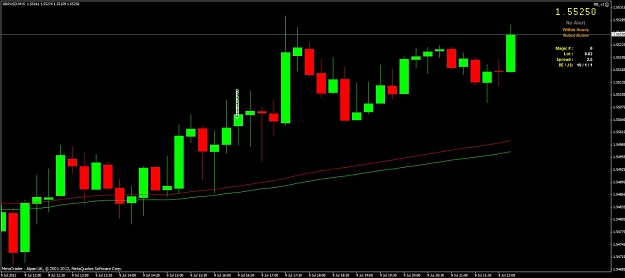
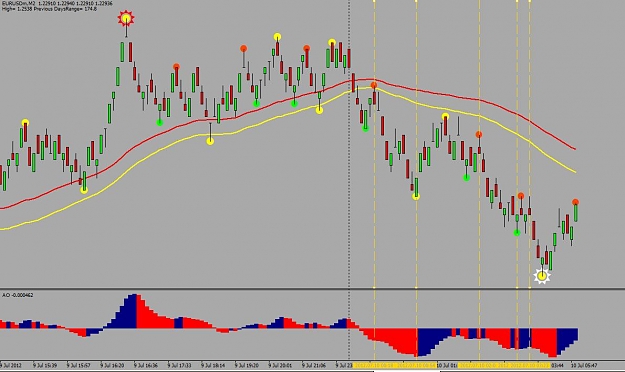
You want a chart that shows some fairly consistant trends above or below the River, you don't want one that looks like a scope display of an audio recording that jumps all over the place and looks like a bunch of noise.
You want a chart that shows some fairly consistant trends above or below the River, you don't want one that looks like a scope display of an audio recording that jumps all over the place and looks like a bunch of noise.
Attached Image (click to enlarge)