Ok folks,
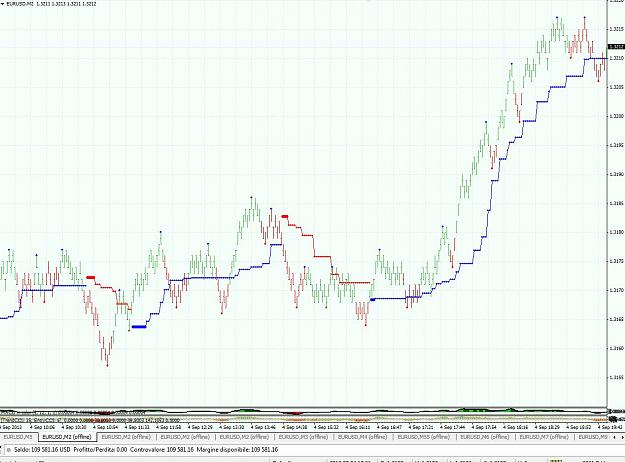
let's see some examples (only one for now, I'm in a hurry) of trading setup for range bars 2 pip trading. First of all, i strongly recommend to restudy the priciples of technical analysis, such as support and resistence concepts and trendline trading. We need only these two weapons to get a winning trading strategy.
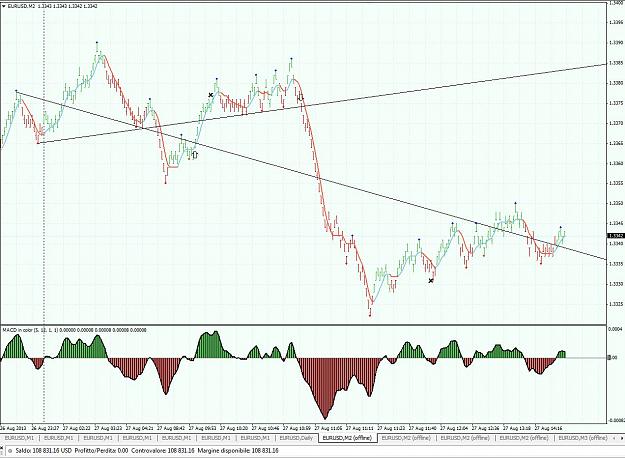
We all know that the price draws continuously waves in its movements. We need an instrument in order to decode this behavior...
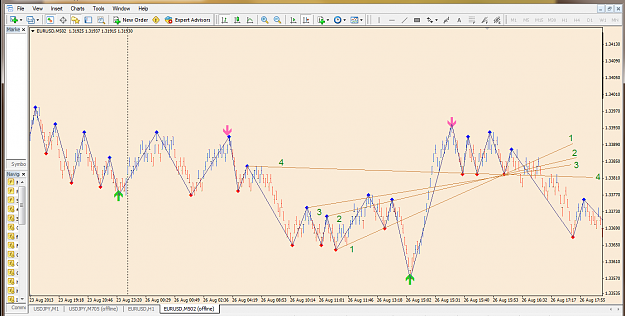
Regarding the way I draw trendlines, I love to connect swing points that have "similar" height. Recently I discovered that Tom Demark points are very similar to what i mean when i think about points with "similar" height", so maybe take a look on that might be useful for you.
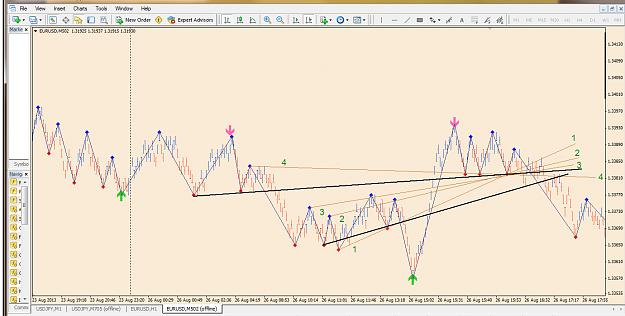
I start drawing from steepest trendline e little by little i draw all the lines that describe the entire movement. Depending on the behavior of the price, I enter into a trade when a bar breaks the trendline. I stop the trade (or I hedge my previous position by opening another of opposite sign and same lot) as soon as the operation is not going in my direction and does not respect the trendline I've drawn.
Rarely I enter a trade after the break of the steepest trendline (very risky trade, because the steepest trendline doesn't allow the price to move, threatening to enter a trade when the price is in retracement phase).
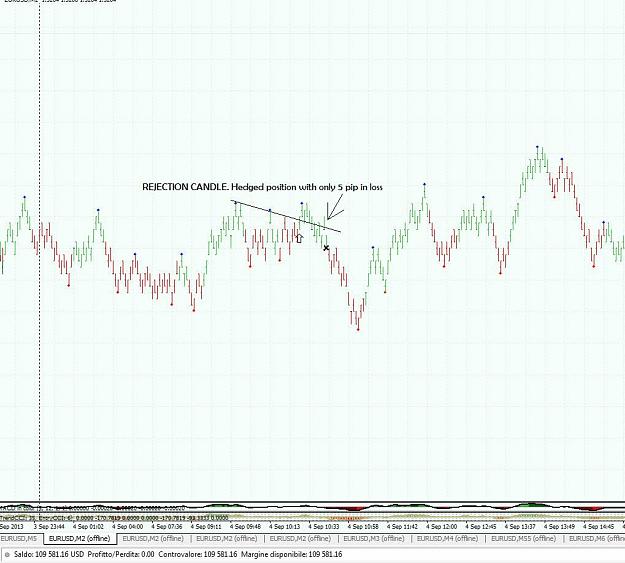
In any case, whichever trendline you choose to enter, the whole key is not in the strategy but in the ability to immediately hedging ourselves (or immediately close the trade) as soon as it goes against you. Don't worry never to close a losing trade because you will have many opportunities every day with range bars 2 pip and rarely you will have a negative day. Sometime it happened to me as well, such as in days of very narrow trading range (12-18 pips) where the price stagnated between one support and one resistance.
Rarely but it happens. It is part of the work, the cost of this job ... and, as such, it should be accepted like a charge, not a loss...
If helpful for you, please post some screenshots in which you need to understand how to draw trendlines and we could compare our ideas.
see you
http://www.mql5.com/en/charts/668800...-m2-ikon-group
let's see some examples (only one for now, I'm in a hurry) of trading setup for range bars 2 pip trading. First of all, i strongly recommend to restudy the priciples of technical analysis, such as support and resistence concepts and trendline trading. We need only these two weapons to get a winning trading strategy.
We all know that the price draws continuously waves in its movements. We need an instrument in order to decode this behavior...
Regarding the way I draw trendlines, I love to connect swing points that have "similar" height. Recently I discovered that Tom Demark points are very similar to what i mean when i think about points with "similar" height", so maybe take a look on that might be useful for you.
I start drawing from steepest trendline e little by little i draw all the lines that describe the entire movement. Depending on the behavior of the price, I enter into a trade when a bar breaks the trendline. I stop the trade (or I hedge my previous position by opening another of opposite sign and same lot) as soon as the operation is not going in my direction and does not respect the trendline I've drawn.
Rarely I enter a trade after the break of the steepest trendline (very risky trade, because the steepest trendline doesn't allow the price to move, threatening to enter a trade when the price is in retracement phase).
In any case, whichever trendline you choose to enter, the whole key is not in the strategy but in the ability to immediately hedging ourselves (or immediately close the trade) as soon as it goes against you. Don't worry never to close a losing trade because you will have many opportunities every day with range bars 2 pip and rarely you will have a negative day. Sometime it happened to me as well, such as in days of very narrow trading range (12-18 pips) where the price stagnated between one support and one resistance.
Rarely but it happens. It is part of the work, the cost of this job ... and, as such, it should be accepted like a charge, not a loss...
If helpful for you, please post some screenshots in which you need to understand how to draw trendlines and we could compare our ideas.
see you
http://www.mql5.com/en/charts/668800...-m2-ikon-group
First rule is not to lose. Second rule is not to forget the first rule...