Today's close will be total bullshit, if we close this low. It makes me more bullish than bearish. I wouldn't be surprised if we went a little below 2820 next week and then broke 3000 also. This is not a normal healthy bearish close what we see today, so something is being prepared...
Everyone can see the chart, but only a few can actually read it.
{quote} Today's close will be total bullshit, if we close this low. It makes me more bullish than bearish. I wouldn't be surprised if we went a little below 2820 next week and then broke 3000 also. This is not a normal healthy bearish close what we see today, so something is being prepared...
Ignored
You are right, it is not a normal healthy bearish close, but I have seen it 1-2 times before in 4 years trading, pretty seldom. Unfortunately I can´t remember what happened afterwards last time
{quote} You are right, it is not a normal healthy bearish close, but I have seen it 1-2 times before in 4 years trading, pretty seldom. Unfortunately I can´t remember what happened afterwards last time
Ignored
Mostly, when a day closes so strongly bearish or bullish, its a sign of a small reversal coming. The top/bottom can be broken the next day, but not for more than 10-20 pips. We will see, if this is the case.
Everyone can see the chart, but only a few can actually read it.
{quote} Today's close will be total bullshit, if we close this low. It makes me more bullish than bearish. I wouldn't be surprised if we went a little below 2820 next week and then broke 3000 also. This is not a normal healthy bearish close what we see today, so something is being prepared...
Ignored
*L* its in the charts. its closing below 2904 and 2853... but not the bigger 2802.. YET
those who can, do. those who cant, talk about those who can
{quote} its just normal pa..from a large b/o. it dont care about small charts.. what most know the past 13 (40) years is not normal
Ignored
For me, normal always has a healthy retrace and a healthy close, if it closes to the pip at the top/bottom, its mostly because something is changing. At least what I remember from the past...everytime a day closed like this, the next day was 50-100 pips in the opposite direction. But this might be different, since nothing is normal since 3990 and no retraces happening, other than on a few consolidation places.
Everyone can see the chart, but only a few can actually read it.
{quote} i try not to think, i said if it did a few things first, mechanical. first go to 2642... it did, now a LL would help it.. here is the order, and its just speculation.. 2842, LL,2842, 2808,,, how it does it i dont care.. the second 2842 does not need to happen.. its just a lying st setup. 2821 on a larger one has yet to be hit
Ignored
done
those who can, do. those who cant, talk about those who can
{quote} For me, normal always has a healthy retrace and a healthy close, if it closes to the pip at the top/bottom, its mostly because something is changing. At least what I remember from the past...everytime a day closed like this, the next day was 50-100 pips in the opposite direction. But this might be different, since nothing is normal since 3990 and no retraces happening, other than on a few consolidation places.
Ignored
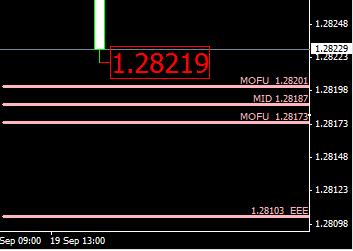
if we cross 2802 then close above, it may bounce in a ping pong to 2904 or 3006.. and any between level.. these are for 0.7xxx.. not being below 2802 atm may cause a bounce. but atm its not giving bull clues. it closed below 2853 and 2904.. once below, it stayed and closed the week below. that's not bullish. next week 2822/23 is another to watch
Attached Image
those who can, do. those who cant, talk about those who can
{quote} if we cross 2802 then close above, it may bounce in a ping pong to 2904 or 3006.. and any between level.. these are for 0.7xxx.. not being below 2802 atm may cause a bounce. but atm its not giving bull clues. it closed below 2853 and 2904.. once below, it stayed and closed the week below. that's not bullish. next week 2822/23 is another to watch {image}
Ignored
Yes, its definitely not bullish on the first sight and no bulls were in house most of the day, new week, new opportunities, so lets see if this can go to 2865+, at least.
Everyone can see the chart, but only a few can actually read it.
{quote} doesn't look like we are going to turn any time soon on my end, but gl.
Ignored
Nope...I thought it will bounce off 2830 and close the day above 2850, but it didn't happen. Still, a bounce to 2900+ I can see happening, before there is an attempt to break 2800.
Everyone can see the chart, but only a few can actually read it.
Joined Jul 2013
|
Status: Form follows function
|4,784 Posts
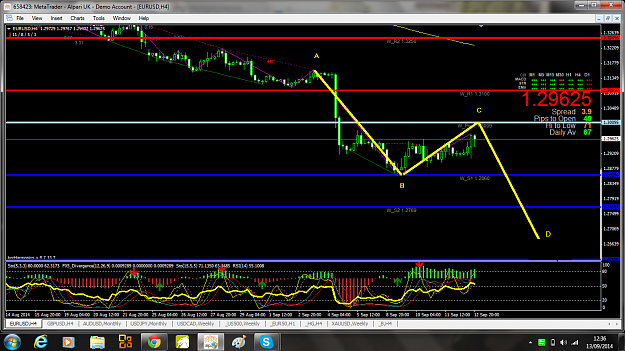
EURUSD
Same pattern, same target, until that happens, there is no point in taking any positions (apart from scalps) imo. 1.2760 major 61.8 Ret Weekly chart is the last support before 1.2190. ABCD is a reversal pattern but this one is only on 4 hours Tf and we need something on daily at least to give us higher probability when taking longs. Watch this level.
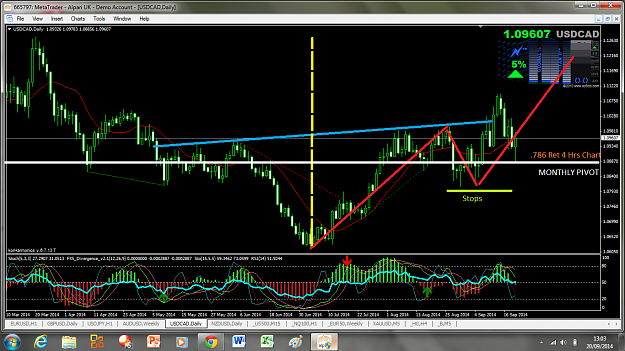
USDCAD On the long timeframes there are some new targets but for entries we need retracement on the 4 hours chart where price completed ABCD after BFly Sell off. Price dropped from last week's Bfly setup (http://www.forexfactory.com/showthre...89#post7721189) 100 pips and stopped at .447 Ret 4 hours chart + Weekly R1 retest to advance another 160 pips breaking above 61.8 Ret Weekly . Ideally we would be looking to a reaction to the .707 Ret Weekly chart + 1.618 Ext 4 Hrs chart (where price is at the moment 1.1095), so not the...
Ignored
USDCAD
I think retracement down is finished and now there is a daily reversal candle from Monthly support and .786 Ret 4 Hours with good reaction. The daily chart below shows an ABCD + H&S and how we could reach the targets posted last week. I tried first long position that didn't work out and then again from M pivot. You can see as well where stops could be hidden or alternatively they could be placed just below the Monthly pivot or, you can enter after retracement on hour chart with same tecnique as usual.
Joined Jul 2013
|
Status: Form follows function
|4,784 Posts
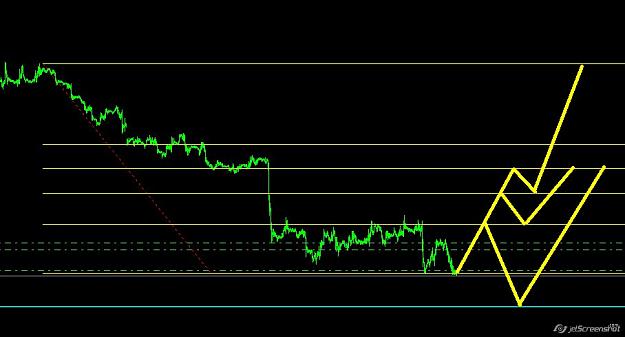
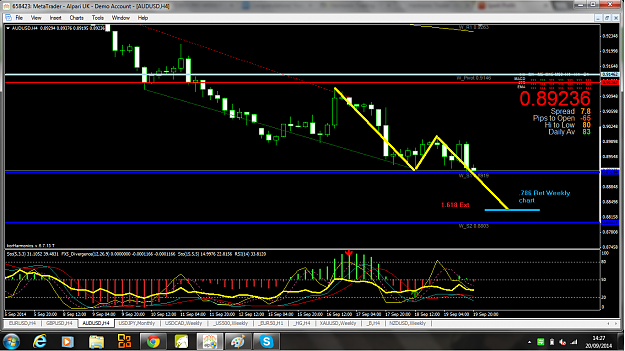
AUDUSD
This appears to be our next destination, completion of this lightning bolt 1.618 Ext + .786 Ret Weekly and bounce up is very likely. The level is 0.8854. Check next retracement on hour chart and you might be able to join party on the way down. The 38.2 Ret 4 hours before diving that you see, is the invalidation point for this pattern.
The pivots on the chart are from last week, you should check new ones for further confluence.