This is a variant of the 7:00am-9:00pm Big Dog Breakout Strategy
Similarities with Big Dog system:
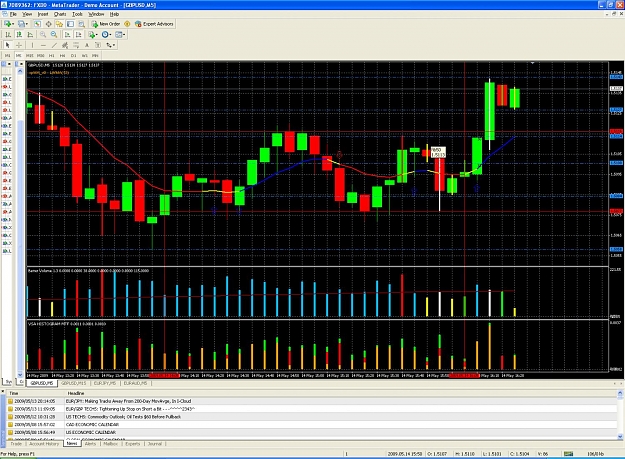
1. Pull out a M15 Chart for a USD Major pair, example like GBPUSD.
2. Draw a vertical line at 14:00 time on your Chart.
3. Draw a vertical line at 16:00 time on your Chart.
4. Draw a Horizontal line at the high of candles/bars in between the vertical
line.
5. Draw a Horizontal line at the Low of candles/bars in between the vertical
line.
---------------------------------------------------------------------
My variation:
Repeat steps for 5m, 15m, 30min/1 HR chart.
6. Add KG RS Group indicator, I prefer the version used in Stephen Hopwood's Kang Gun Relative Strength Trading EA, it's zipped with the EA.
This is a relative strength indicator that will show you the weakest/strongest currencies and everything in between, it's used for basket trading strategies. Precludes the need to have 54435 charts open. Can also be used to identify the best pair to trade. I've been sticking to GBP/usd so far for familiarity.
7. Add xp_Ma indicator with defaults.
9. Add daily fib indicator.
9. (optional) Trying to integrate volume spread analysis (VSA) into my trading. This indicator can be good to spot reversals. The "Volume" is really counting ticks, as far as I understand.
What to watch for:
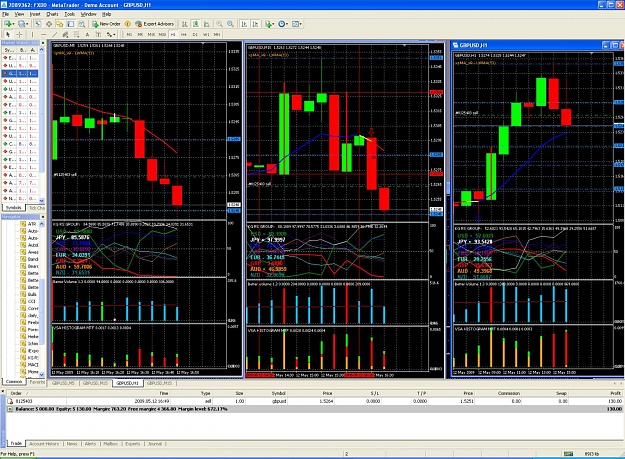
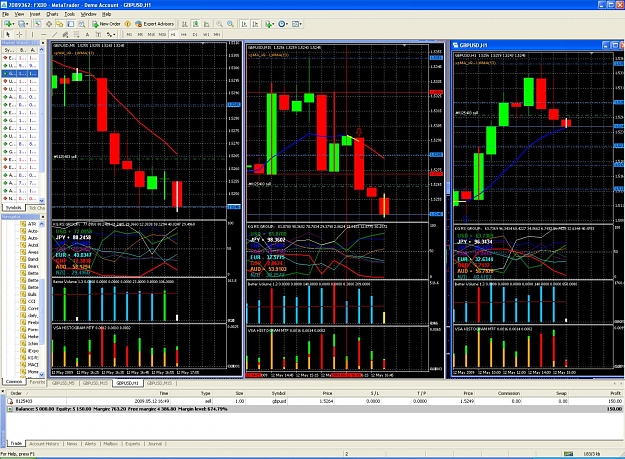
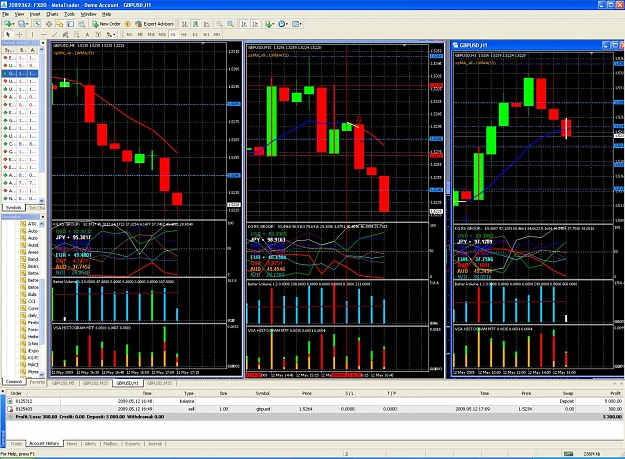
As the first image shows, 1.5272 is the box bottom, 1.5328 is the top.
Primarily looking at the xp_MA indicator to shine it's arrow and line to turn red. This is my main signal to go short, especially if it's breaking down past a fib level. TP is the next lowest daily Fib. If you see strong momentum maybe even TP on the second fib down.
Confirmation:
Look at the KG RS Group indicator. GBP=red line, USD=green line. at 16:20 dollar diverges up. However as it extends over the 50% line and up near 80 or so I want out of the position.
I just started using this please give me any suggestions on it!
I feel this is a bit safer than the original system which blindly puts buy and sell orders with stops at the opposite ends of eachother. You've got to make back all of those pips on the profitable leg. Also, it's all too easy to get whipsawed out of the trade if price pierces your long stop then bounces. Then you lose twice.
Similarities with Big Dog system:
1. Pull out a M15 Chart for a USD Major pair, example like GBPUSD.
2. Draw a vertical line at 14:00 time on your Chart.
3. Draw a vertical line at 16:00 time on your Chart.
4. Draw a Horizontal line at the high of candles/bars in between the vertical
line.
5. Draw a Horizontal line at the Low of candles/bars in between the vertical
line.
---------------------------------------------------------------------
My variation:
Repeat steps for 5m, 15m, 30min/1 HR chart.
6. Add KG RS Group indicator, I prefer the version used in Stephen Hopwood's Kang Gun Relative Strength Trading EA, it's zipped with the EA.
This is a relative strength indicator that will show you the weakest/strongest currencies and everything in between, it's used for basket trading strategies. Precludes the need to have 54435 charts open. Can also be used to identify the best pair to trade. I've been sticking to GBP/usd so far for familiarity.
7. Add xp_Ma indicator with defaults.
9. Add daily fib indicator.
9. (optional) Trying to integrate volume spread analysis (VSA) into my trading. This indicator can be good to spot reversals. The "Volume" is really counting ticks, as far as I understand.
Attached File(s)
Attached File(s)
Attached File(s)
Attached File(s)
Attached File(s)
Attached File(s)
What to watch for:
As the first image shows, 1.5272 is the box bottom, 1.5328 is the top.
Primarily looking at the xp_MA indicator to shine it's arrow and line to turn red. This is my main signal to go short, especially if it's breaking down past a fib level. TP is the next lowest daily Fib. If you see strong momentum maybe even TP on the second fib down.
Confirmation:
Look at the KG RS Group indicator. GBP=red line, USD=green line. at 16:20 dollar diverges up. However as it extends over the 50% line and up near 80 or so I want out of the position.
I just started using this please give me any suggestions on it!
I feel this is a bit safer than the original system which blindly puts buy and sell orders with stops at the opposite ends of eachother. You've got to make back all of those pips on the profitable leg. Also, it's all too easy to get whipsawed out of the trade if price pierces your long stop then bounces. Then you lose twice.